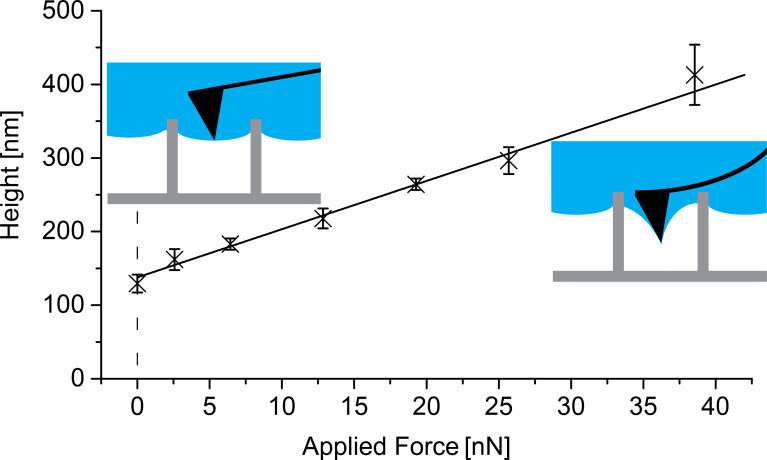
Figure 9.
Water depth relative to the pillar tops as a function of force applied during scanning. For each data point, a complete 10 × 10 µm scan (similar to that shown in Figure 8a) was taken with an individual and constant force applied to the air–water interface by the cantilever. The values, as well as the corresponding error bars, were determined by the “particle analysis” procedure of the AFM software. The higher the applied force, the larger the compression of the air and hence distance between the pillar tops and air–water interface, as schematically shown in the insets. With a set point of 0 nN (zero resulting force) a height of 129 ± 12 nm was measured, which is in very good agreement with the value of 138 ± 4 nm determined by the linear regression of all data points.

