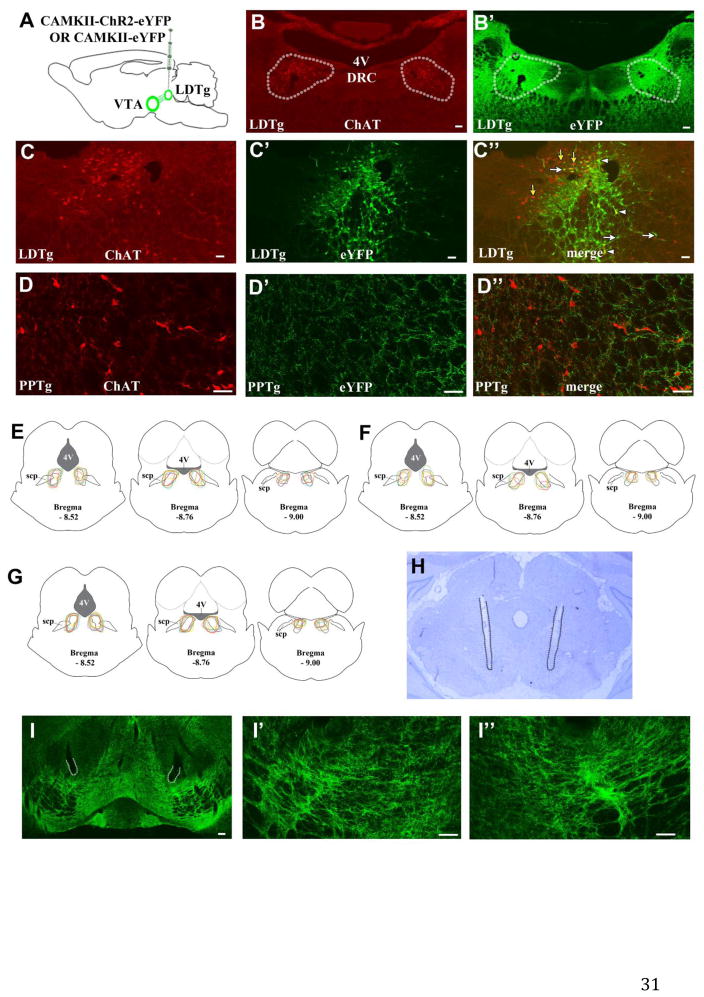
Figure 1. LDTg transfection with AAV5-CAMKII-ChR2-eYFP results in eYFP expression within the LDTg and the VTA.
A. LDTg neurons were bilaterally transfected with AAV5-CAMKII-ChR2-eYFP or AAV5-CAMKII-eYFP in rats. B–B′. The boundaries of the LDTg are defined by the extent of ChAT labeling (traced according to B) and are superimposed on to the image in B′. Bilateral eYFP expression was observed within the boundaries of the LDTg (B′). C–C″. eYFP-labeled (white arrows), eYFP/ChAT double-labeled (white arrow heads) and ChAT single-labeled (yellow arrows) cells were observed within the LDTg. D–D″. No eYFP-labeled cells (D′) were observed within the adjacent PPTg, located rostral and lateral to the LDTg (defined by ChAT expression; D). However, eYFP-labeled processes were observed within the proximity of ChAT-labeled cells (D″). E–G. Schematic representations of eYFP expression in relation to LDTg boundaries (dashed outlines) in rats transfected with AAV5-CAMKII-ChR2-eYFP used for the NAcc microdialysis studies (E; n = 6), the NAcc core D1/D2 DA receptor antagonist studies (F; n = 6), or the NAcc shell D1/D2 DA receptor antagonist studies (G; n = 7). Outlines for individual rats are shown in different colors at three A-P levels. eYFP expression was consistently observed within the boundaries of the LDTg. H. Representative cresyl-violet stained section showing the VTA and bilateral optic probes (tracks marked by dotted lines). VTA fiber optic tip placements for individual rats are shown in Fig 2B. I–I″. eYFP expression was observed in the VTA following LDTg transfection with AAV5-CAMKII-ChR2-eYFP. The areas adjacent to probe tips outlined at low magnification in I are shown at higher magnification in I′ (left VTA) and I″ (right VTA). Scale bars: 100 μm in B, B′, I; 50 μm in C, C′, C″, D, D′, D″, I′, I″. DRC, dorsal raphe nucleus, caudal part. scp, superior cerebellar peduncle. 4V, 4th ventricle.

