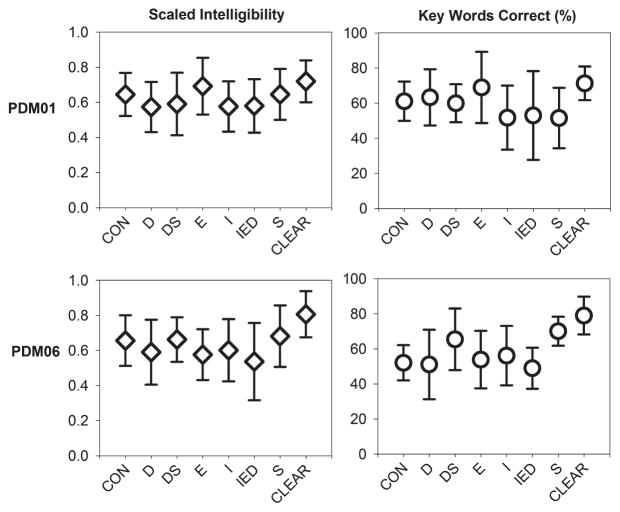
Figure 4.
Mean percentage correct scores and scale values pooled across sentences and listeners are reported. Vertical bars indicate ±1 SD. Results for conversational (CON) and clear stimuli are shown on the extremes of the x-axis, and results for hybrids—duration (D); the combination of duration and short-term spectrum (DS); energy (E); intonation (I); prosody, defined as the combination of intonation, energy, and duration (IED); and short-term spectrum (S)—are reported in the middle of the x-axes.

