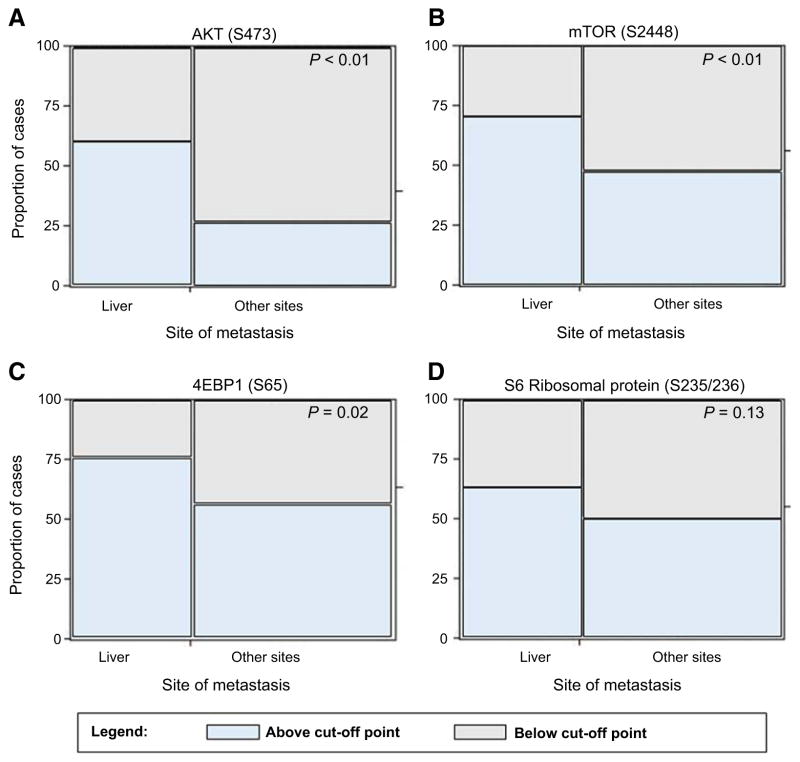
Figure 3.
Mosaic plots representing activation of AKT (S473) and downstream substrates mTOR (S2448), S6RP (S235/236), and 4EBP1 (S65) across 154 metastatic breast cancer. Proportion of positive patients is plotted along with the site of metastasis. P values were calculated using a Fisher exact test.

