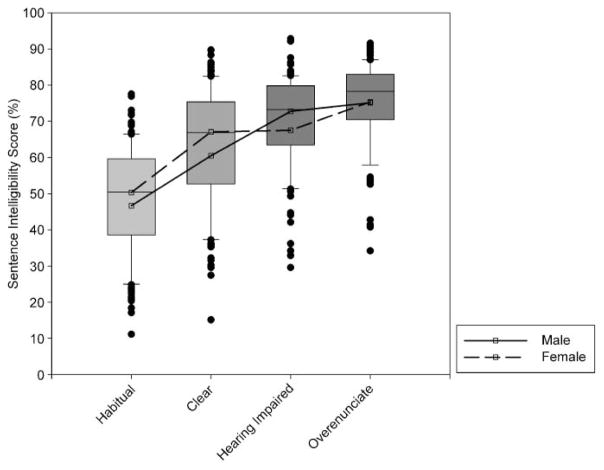
Figure 1.
Distributions of individual listener Sentence Intelligibility Test (SIT) scores as a function of condition. Square symbols connected by a solid or dashed line represent average intelligibility scores for male and female speakers, respectively. Error bars represent the 10th and 90th percentiles.

