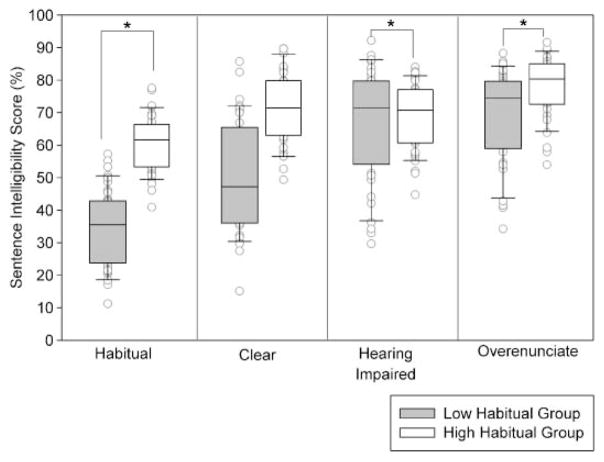
Figure 2.
Distributions of individual listener SIT scores as a function of condition and group. Data for the high habitual intelligibility speaker group are shown in white, and data for the low habitual intelligibility speaker group are shown in gray. Error bars represent the 10th and 90th percentiles. *p < .05.

