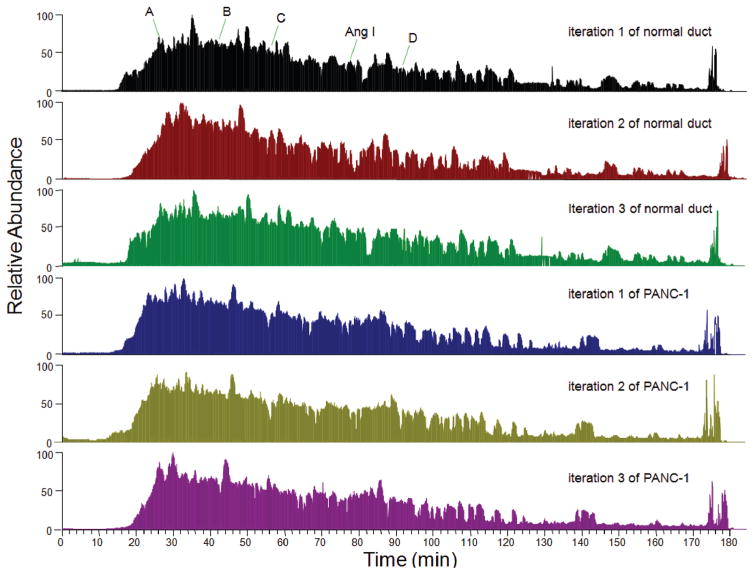
Figure 1.
Chromatogram of LC–MS/MS analysis of tryptic peptides from normal pancreatic duct and PANC-1 cells. Twenty microgram tryptic peptides and 100 fmol standard peptide Ang I were loaded to C18 capillary column, and the eluted peptides were analyzed by LTQ-Orbitrap. For the first iteration of normal duct sample, the retention time of exogenous control Ang I was 78 min, and the retention times of 4 internal control peptides were 26 min, 42 min, 56 min, and 91 min respectively. Labeled peak A is the peptide IWHHTFYNELR (2+ ion, m/z 758.3766) from actin, gamma 1; peak B is the peptide VAPEEHPVLLTEAPLNPK (2+ ion, m/z 977.5364) from actin, gamma 1; peak C is the peptide LGEHNIDVLEGNEQFINAAK (2+ ion, m/z 1106.0545) from trypsin autolysis; peak D is the peptide LCYVALDFEQEMATAASSSSLEK (2+ ion, m/z 1275.5953) from actin, gamma 1. The mass accuracy of these peptides was within 5 ppm. These peptides were also identified in the second and third iterations of normal duct sample, and in 3 iterations of PANC-1 sample with similar retention times (±2.0 min), indicating that the experimental procedure was reproducible and the MS results could be compared.

