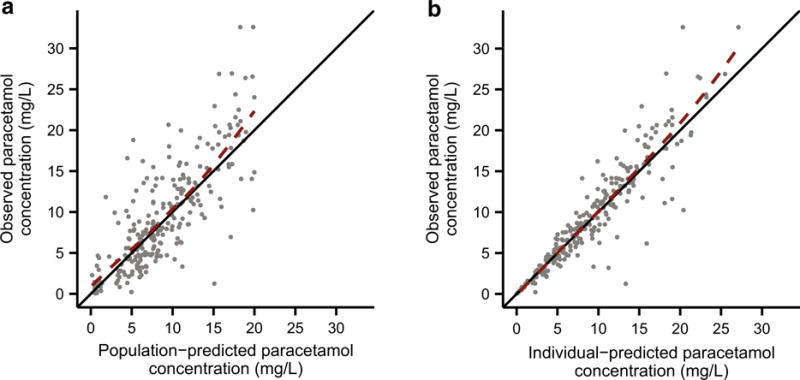
Fig. 1.

Diagnostic plots for the final covariate model. Observed versus a population-predicted and b individual-predicted paracetamol plasma concentrations. The solid black lines depict the lines of identity (y = x), and the dashed red lines depict the LOESS fits of the data
