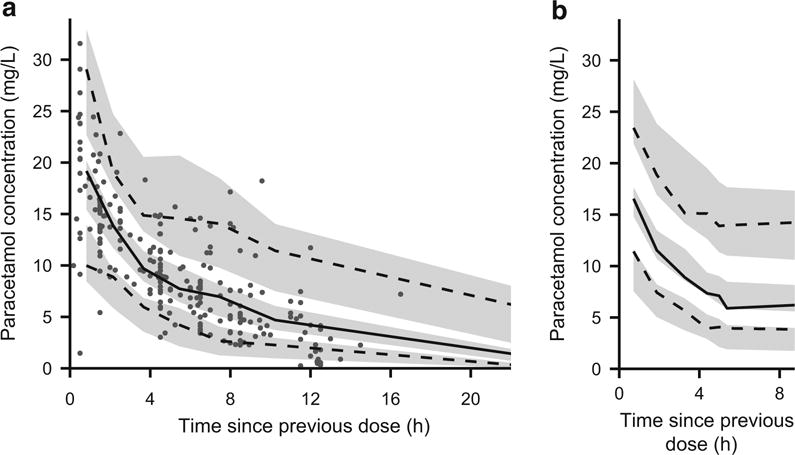
Fig. 4.

Visual predictive checks of the final covariate model for a the model-building dataset and b the external evaluation dataset. The solid black lines depict the observed 50th percentiles, and the dashed black lines depict the observed 5th and 95th percentiles. The shaded gray regions depict the 95 % confidence intervals surrounding the predicted 5th, 50th, and 95th percentiles. Individual observations are depicted as gray dots. Individual observations were omitted from b because the density of points would obscure the percentile lines and prediction intervals
