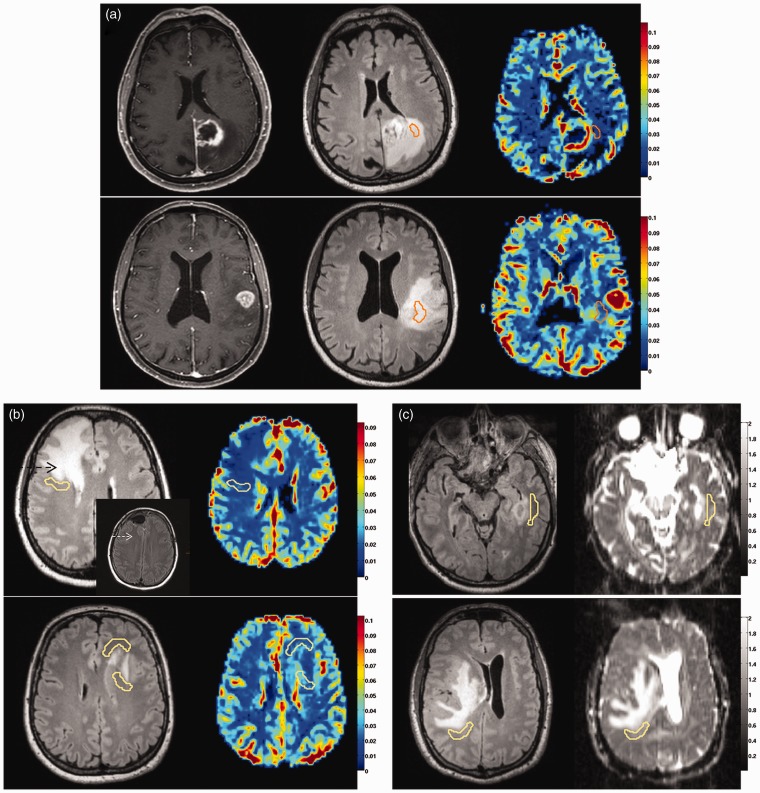
Figure 1.
Radiophenomic modules.
(a) Necrosis-related module with pronounced (upper row) or minor necrosis (lower row). From left to right: contrast-enhanced T1 image, FLAIR image, CBV map. The ROI shown is “flair_hyper”.
(b) Edema/infiltration-related module with edema (upper row, black arrow) and its release after operation (insert with white arrow), or presence of infiltration (lower row). The ROI “NAM_outside” is shown on the FLAIR images (left) and on the CBV maps (right).
(c) Proliferation-related module with mild or no mass effect (upper row) versus moderate to severe mass effect (lower row). The ROI “NAM_outside” is shown on the FLAIR images (left) and on the AD maps (right).
FLAIR: fluid-attenuated inversion recovery; CBV: cerebral blood volume; ROI: region of interest; NAM: normal-appearing matter.

