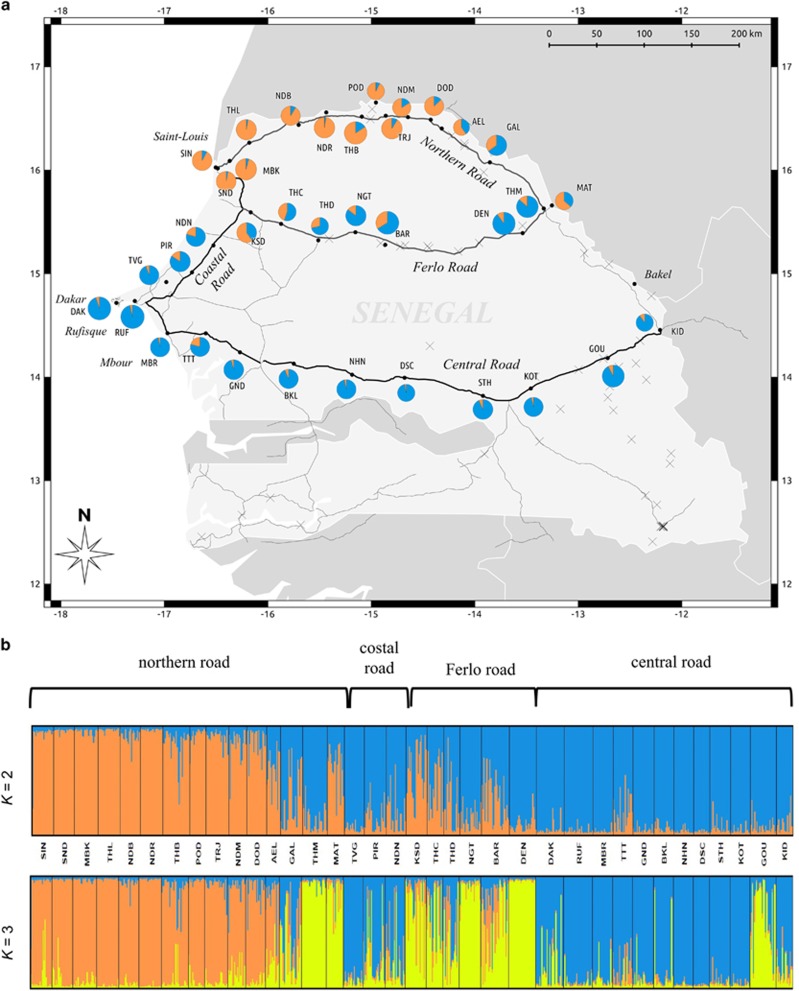
Figure 1.
Geographic origin and genetic clustering of sampling sites (code names in Table 1) for Mus musculus domesticus in Senegal. (a) Geographic distribution of the two main genetic groups (K=2) obtained using STRUCTURE. For each site, colours in pie charts indicated the proportions of house mice that were assigned to each genetic group. (b) Individual ancestry estimates assuming two or three genetic groups in STRUCTURE. Each vertical line represents an individual, and each colour represents a genetic group. Individuals are grouped by site and sites are ordered along each sampled road according to a west–east gradient. Clustering patterns obtained with TESS were similar (Supplementary Figure S4).

