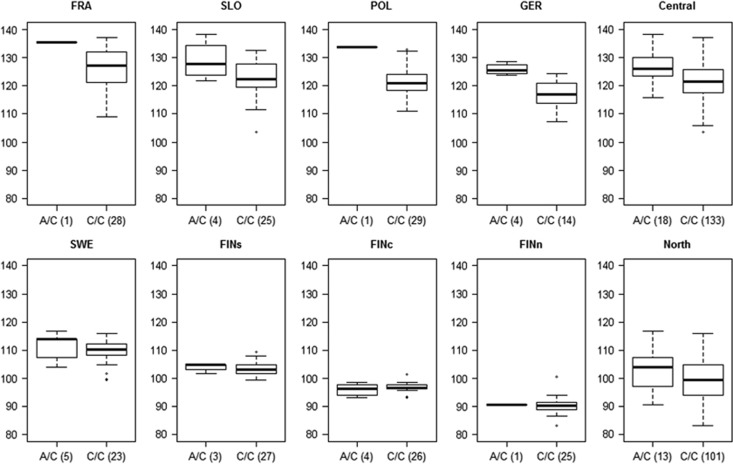
Figure 3.
Distribution of family means of days to bud set in different genotype classes of SNP CL1966Contig1_05-341 (genotype counts in parentheses). On the left individual populations are shown, on the right the populations are combined (Central, North). Genotype A/A was omitted from this picture for clarity as it was observed in only a few populations. Only four out of six central populations are shown here.

