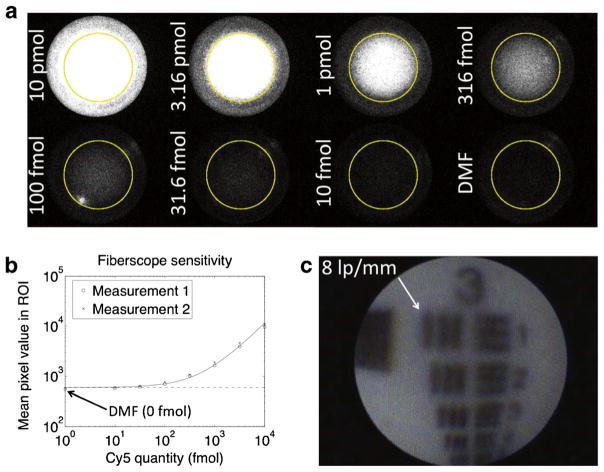
Fig. 2.
Fiberscope fluorescence sensitivity and white-light resolution tests. a Fluorescence images of Cy5 dilutions in wells. Images are contrast scaled equally for visualization but not quantitation. b Average fluorescence signals within ROIs. c White-light image of 1951 USAF resolution test pattern showing the fiberscope’s ability to resolve eight line pairs/millimeter (62.5 μm line thickness).

