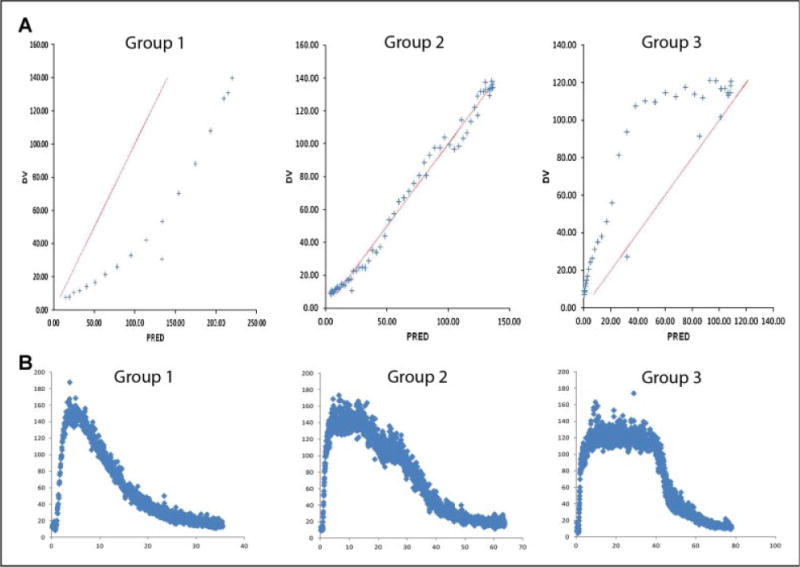
Figure 1.

Predicted versus actual flux. Panel A: Representative predicted (PD) on the x-axis versus actual (DV) on the y-axis flux (perfusion units provided by the manufacturer) plots which suggest distinct histamine response types. Group 1, hypo-responsive group; Group 2, neutro-responsive group; Group 3, hyper-responsive group. Panel B: Representative actual flux vs. time curves which correspond to above histamine response types. Group 1, hypo-responsive group; Group 2, neutro-responsive group; Group 3, hyper-responsive group.
