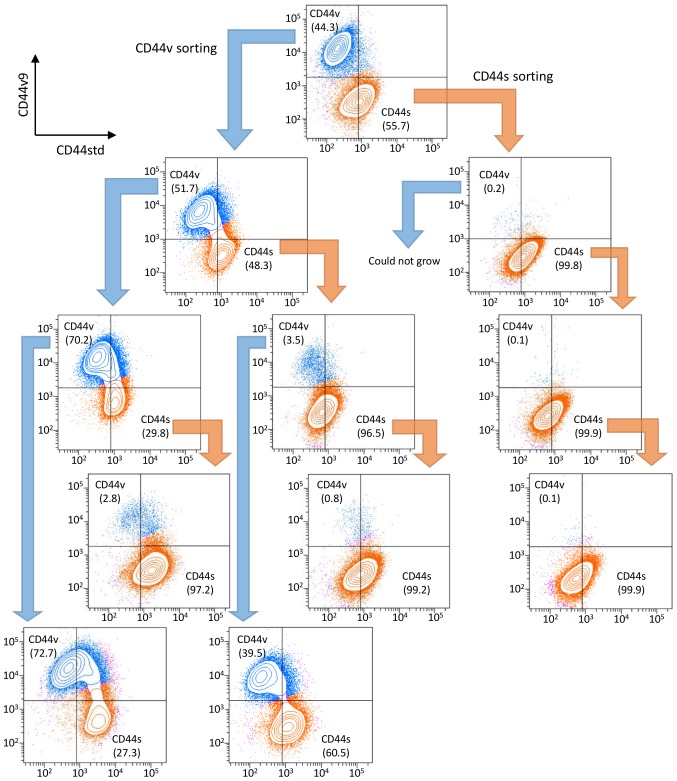
Figure 2.
Sequential expression analysis of CD44std and CD44v9. CD44std+/CD44v9− (CD44s) cells and CD44std−/CD44v9+ (CD44v) cells were recultured and analyzed 1 to 2 weeks after sorting. CD44std and CD44v9 expression in recultured NOZ-CD44v and NOZ-CD44s cells are shown below the former analysis. The populations of CD44s and CD44v are orange and blue, respectively, and the percentage of each population is shown. These procedures were repeated until the third sorting.

