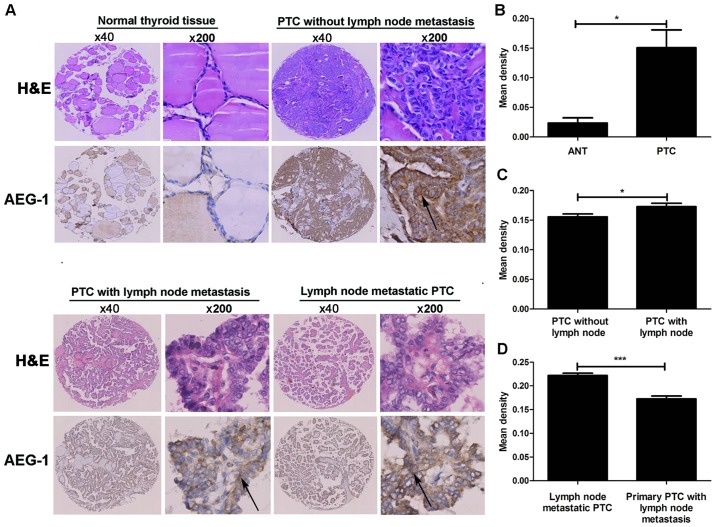
Figure 2.
AEG-1 in PTC by immunohistochemical staining. (A) AEG-1 expression is shown in normal thyroid tissue, primary PTC without lymph node metastasis, primary PTC with lymph node metastasis and lymph node metastatic PTC, and the arrow shows the area of AEG-1 staining. (B) AEG-1 expression was elevated in PTC compared with that in ANT, *P<0.05. (C) AEG-1 expression was elevated in PTC with lymph node metastasis compared with PTC without lymph node metastasis, *P<0.05. (D) AEG-1 expression was elevated in lymph node metastatic PTC compared with respective primary PTC, ***P<0.001.

