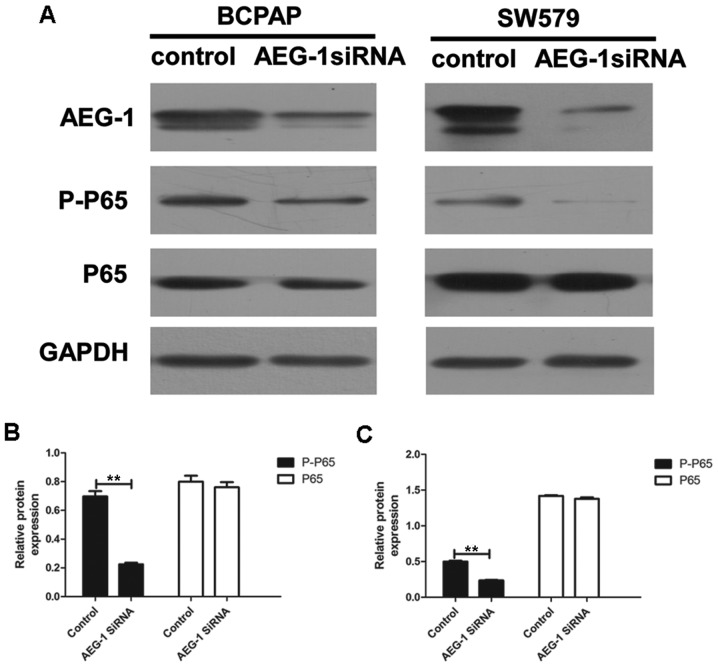
Figure 7.
AEG-1 affects NF-κB pathway in BCPAP and SW579. (A) Western blot analysis of the expression of AEG-1, phospho-p65, total p65, in control and AEG-1-infected thyroid cancer cell lines. Each experiment was performed three times in triplicate. (B) The gray intensity of phospho-p65 of AEG-1-infected BCPAP was lower than control (P=0.007), with no difference of total p65 (P=0.552), **P<0.01. (C) The gray intensity of phospho-p65 of AEG-1-infected SW579 was lower than control (P=0.004), with no difference of total p65 (P=0.229), **P<0.01.

