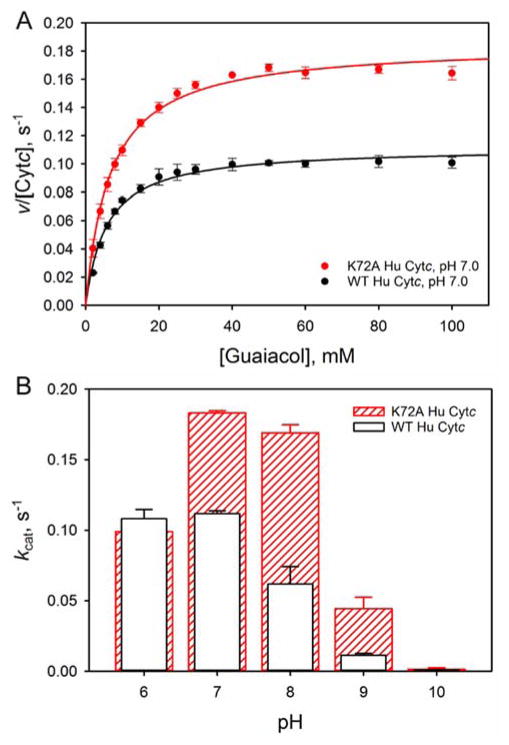
Figure 6.
Peroxidase activity of WT (black) and K72A (red) Hu Cytc. (A) Michaelis-Menten plots for WT (solid black circles) and K72A (solid red circles) Hu Cytc at pH 7. The solid curves are fits to eq 3 (Experimental Procedures). Data were acquired at 25 °C in 10 mM buffer and 100 mM NaCl. (B) kcat versus pH for WT (white bars black outline) and K72A (red outlined bars with slashes) Hu Cytc. Error bars are the standard deviation from three independent experiments.

