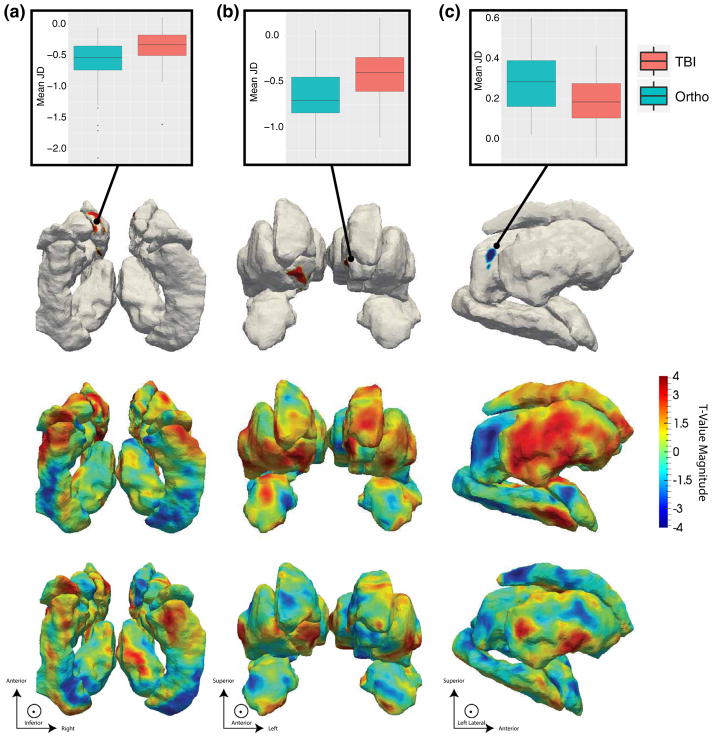
Fig. 2.
t-Value maps of the regression of the Jacobian determinant (JD) on the ortho-TBI contrast from a inferior, b anterior and c left perspectives. Note that all images are in radiological orientation, i.e. left–right flipped. The top row plots the average JD within regions differing significantly between TBI and Orthopedic groups. The second row illustrates FDR-thresholded t value maps in which only highlighted regions are significant. The third row maps Jacobian t values across the entire set of surfaces. The bottom row compliments this by mapping the associated t values for the local thickness (RD) measure to determine whether changes in local surface area result from concavity or convexity. Here, the directions of the JD and RD associations agree within regions of significance indicating that regions in red result from dilation while regions in blue are suggestive of atrophy. All coefficient t values had 125 degrees of freedom

