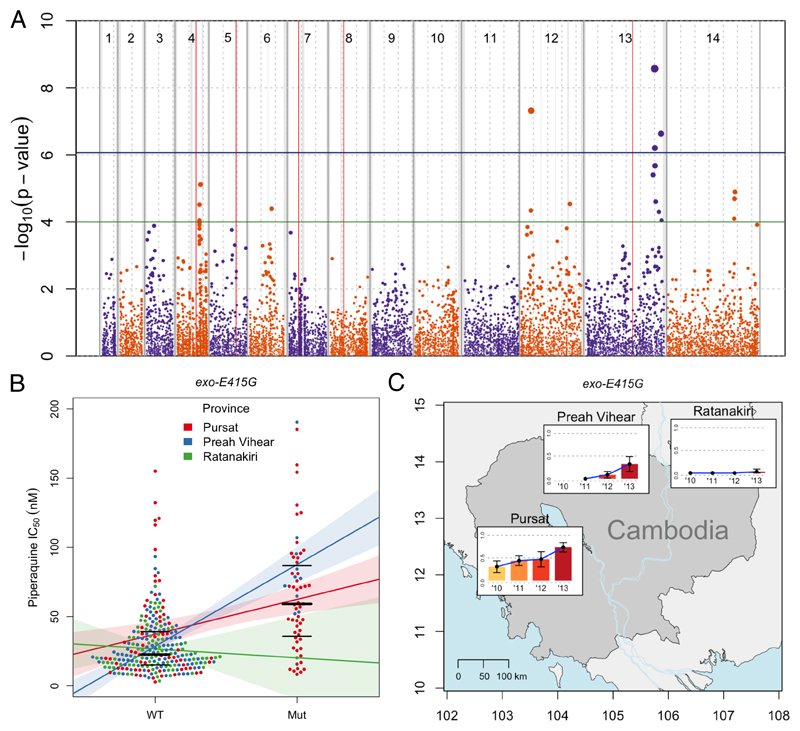
Figure 1. Manhattan plot showing the statistical significance level of SNP associations in the GWAS (A), piperaquine IC50s (B), and exo-E415G frequency distribution (C).
(A) Each point represents 1 of the 11,630 SNPs with MAF>0.033 in the set of 297 P. falciparum clinical isolates, coloured according to chromosome. Genomic location is shown on the x-axis. The p value for each SNP's association, calculated using a linear mixed model, is shown on the y-axis; point size is proportional to significance level. Province of sample origin, status of kelch13 (mutant vs wild-type), presence or absence of mdr1 amplification, and a genetic relatedness matrix were added as fixed effects to the analysis. 4 SNPs reached the Bonferroni-corrected, genome-wide significance level of p≤8.6×10⁻⁷ (above horizontal blue line). Loci containing these significant SNPs, plus those containing suggestive SNPs reaching the significance level of p≤10−4 (above horizontal green line), are listed in Table 1. Vertical red lines mark known drug resistance loci: dhfr, mdr1, crt, dhps, and kelch13 on chromosomes 4, 5, 7, 8, and 13, respectively. Dashed grey vertical lines are plotted every 500 Kbp from the beginning of each chromosome. Solid grey vertical boxes mark telomeric, sub-telomeric, and internal hypervariable regions. (B) Each point represents the piperaquine IC50 for a P. falciparum clinical isolate carrying the wild-type ‘A’ allele (WT) or mutant ‘G’ allele (Mut) allele of exo-E415G (Pf3D7_13_v3:2504560). Bold and thin horizontal lines indicate the median and interquartile range of each distribution, respectively. Samples are divided into 3 coloured groups depending on their geographical origin. Coloured lines represent the least-squares linear regression of the phenotype on the 2 genotypes, calculated in each group separately. Shaded areas represent 95%CIs of the regression. (C) Coloured bars indicate the mutant allele frequencies in each of the 3 provinces over time (no samples were available from Preah Vihear in 2010). Error bars indicate 95% confidence intervals of the estimation. Geographical coordinates are shown on the axes.

