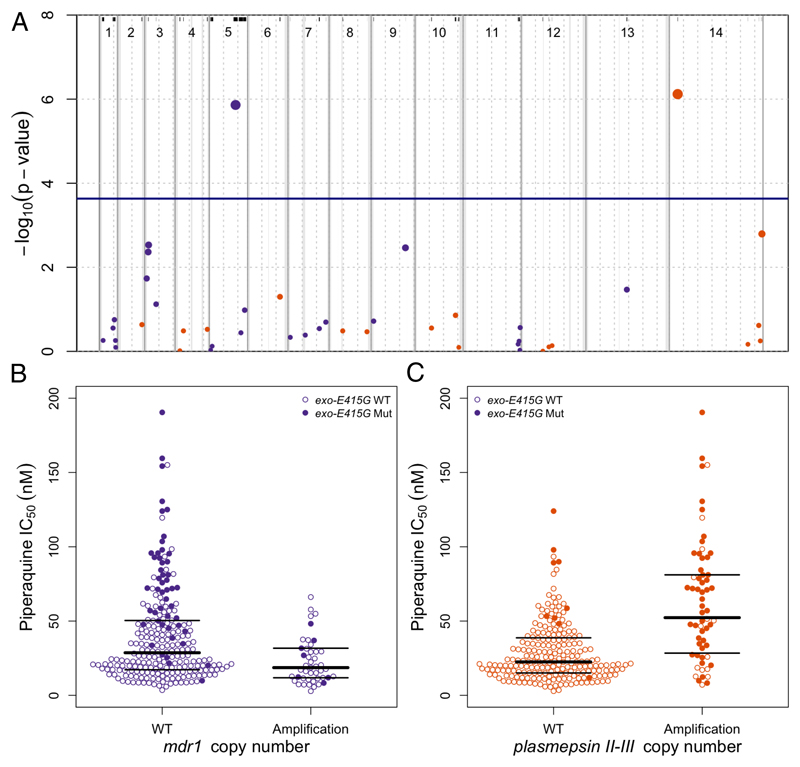
Figure 2. Manhattan plot showing the statistical significance level of CNV associations in the GWAS (A) and piperaquine IC50s according to mdr1 and plasmepsin II-III copy number (B).
(A) Each point represents 1 of the 43 CNVs present in ≥5 samples, coloured according to chromosome. Genomic location is shown on the x-axis. The p value for each CNV's association, calculated using a linear mixed model, is shown on the y-axis; point size is proportional to significance level. The province of sample origin, status of kelch13 (mutant vs wild-type), and a genetic relatedness matrix were added as fixed effects to the analysis. 2 CNVs reached the Bonferroni-corrected, genome-wide significance level of p≤2.3×10⁻⁴ (above the horizontal blue line), 1 including plasmepsin II and plasmepsin III, and 1 including mdr1. All 43 CNVs are marked by black lines at the top and are listed in supplementary table 3. Dashed grey vertical lines are plotted every 500 Kbp from the beginning of each chromosome. Solid grey vertical boxes mark telomeric, sub-telomeric, and internal hypervariable regions. (B, C) Each point represents the piperaquine IC50 for a P. falciparum clinical isolate carrying wild-type (WT) or amplified (Amplification) mdr1 (B) or plasmepsin II-III (C) genes. Bold and thin horizontal lines indicate the median and interquartile range of each distribution, respectively. Filled circles identify samples also carrying exo-E415G.

