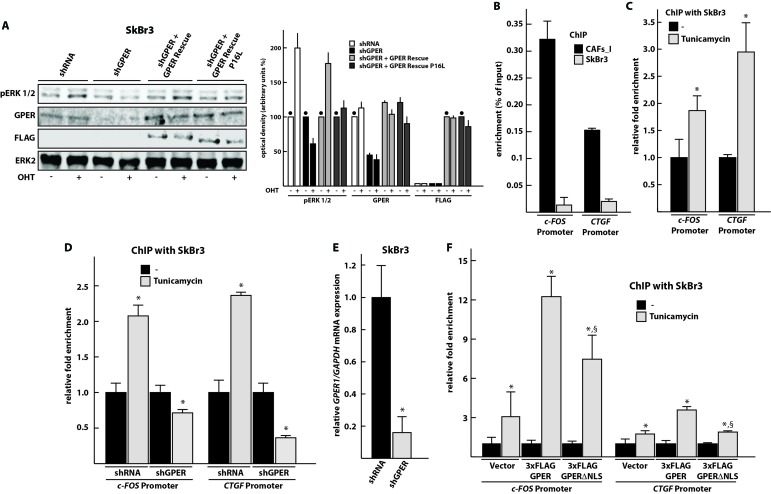
Figure 6. GPER localized to the nucleus is unable to stimulate MAPK signaling, but can be recruited to the promoters of its target genes c-FOS and CTGF.
A. Immunoblots showing ERK1/2 phosphorylation upon activation of GPER with OHT. Other panels display the total levels of ERK2, and the levels of endogenous GPER and exogenous FLAG-GPER in transfected SkBr3 cells. The transfected SkBr3 cells were treated for 30 min with vehicle (-) or 10 μM OHT. The panel on the right shows the densitometric quantitation of the blots normalized to ERK2 expression levels; each bar represents the average of two independent experiments with the lines on top indicating the range of the two values; the black dots indicate the samples, arbitrarily set to 100%, relative to which the values of the other samples of a set were calculated. B. GPER is recruited to the promoters of its target genes c-FOS and CTGF in CAFs_I. CAFs_I and SkBr3 cells were used to perform a ChIP assay with an anti-GPER antibody. C. Tunicamycin treatment induces the recruitment of GPER on the promoters of its target genes in SkBr3 cells, treated for 24 hours with 5 μg/ml tunicamycin and then used to perform ChIP experiments using an anti-GPER antibody. D. ChIP experiment to assess recruitment of GPER to target sites with SkBr3 cells transfected for 24 hours with shRNA or shGPER constructs and then treated for additional 24 hours with 5 μg/ml tunicamycin. ChIP experiments were performed using an anti-GPER antibody. E. Control RT-PCR experiment to verify the effectiveness of shGPER-mediated knock-down of the GPER mRNA 48 hours after transfection. Values were normalized to GAPDH expression, and presented as fold change (mean ± SD) of shGPER transfected cells relative to cells transfected with a control shRNA construct. F. ChIP experiment to assess recruitment of NLS-defective GPER to target sites. In this case, the ChIP was done with an anti-FLAG antibody. In ChIP experiments, the specific precipitation of AT-rich sequences from the c-FOS and CTGF promoters was evaluated by real-time PCR; enrichment was calculated relative to input (in panel B) as well as standardized to the untreated controls set to 1 (in panels C, D, and F). Bar graphs show the means ± SD of three independent experiments. *, p-value ≤ 0.05 for comparison to respective untreated (or shRNA) control; §, p-value ≤ 0.05 for comparison to corresponding wild-type GPER plasmid (panel F).

