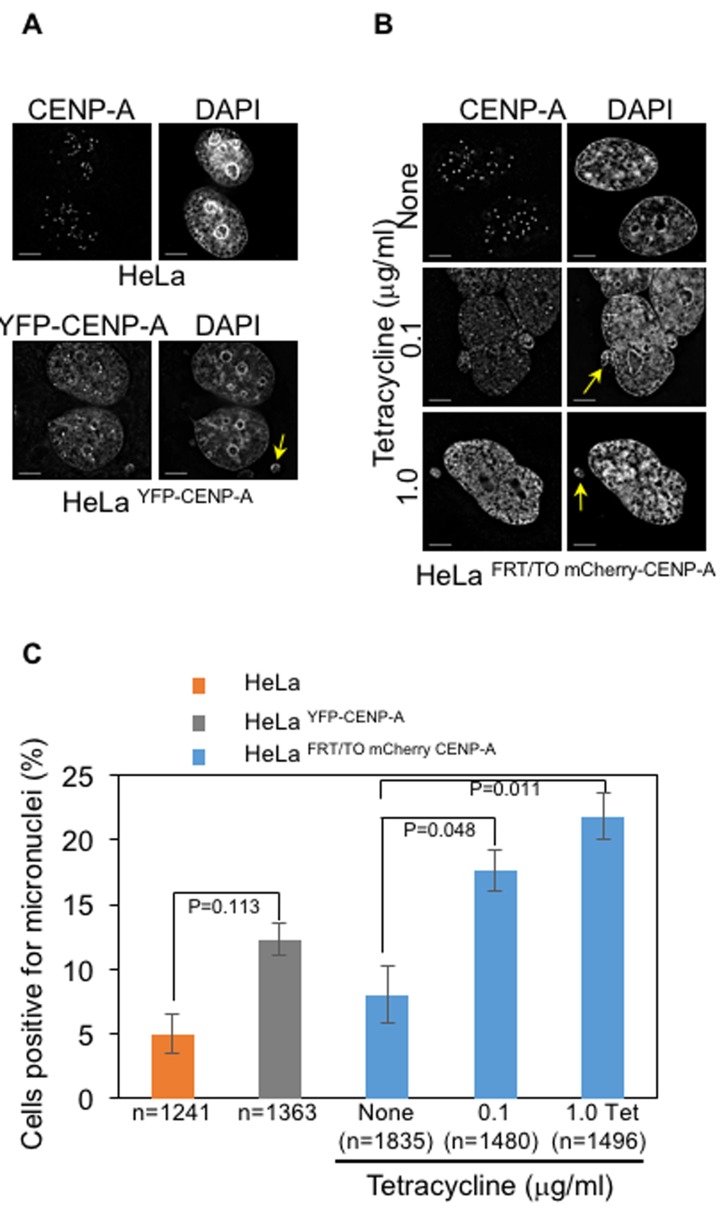
Figure 3. CENP-A overexpression contributes to increased incidence of micronuclei in human cells.
A.-B. Constitutive and inducible expression of CENP-A contribute to increased incidence of micronuclei. Immunofluorescence images of HeLa and Hela YFP-CENP-A (A) and HeLa FRT/TO mCherry-CENP-A (B) show presence of micronuclei in interphase cells. Prior to immunostaining, HeLa FRT/TO mCherry-CENP-A cells were treated with different concentrations of tetracycline. Cells were immunostained with antibodies against CENP-A for HeLa and HeLa FRT/TO mCherry-CENP-A and GFP for Hela YFP-CENP-A to visualize CENP-A. Cells were also stained with DAPI for DNA. Immunostained cells were imaged and analyzed for presence of micronuclei. Yellow arrows show micronuclei in HeLa YFP CENP-A and HeLa FRT/TO mCherry-CENP-A cells treated with different concentrations of tetracycline. Scale bar: 5 μm. C. Proportion of cells positive for micronuclei is higher in CENP-A overexpressing cells. Bar chart shows the proportion of HeLa, HeLa YFP-CENP-A and HeLa FRT/TO mCherry-CENP-A with micronuclei. Error bars represent standard error of mean (SEM) from three (for HeLa and HeLa YFP CENP-A) or six (for HeLa FRT/TO mCherry CENP-A) independent experiments. ‘n’ denotes number of cells analyzed. P-values calculated using the proportion test are indicated

