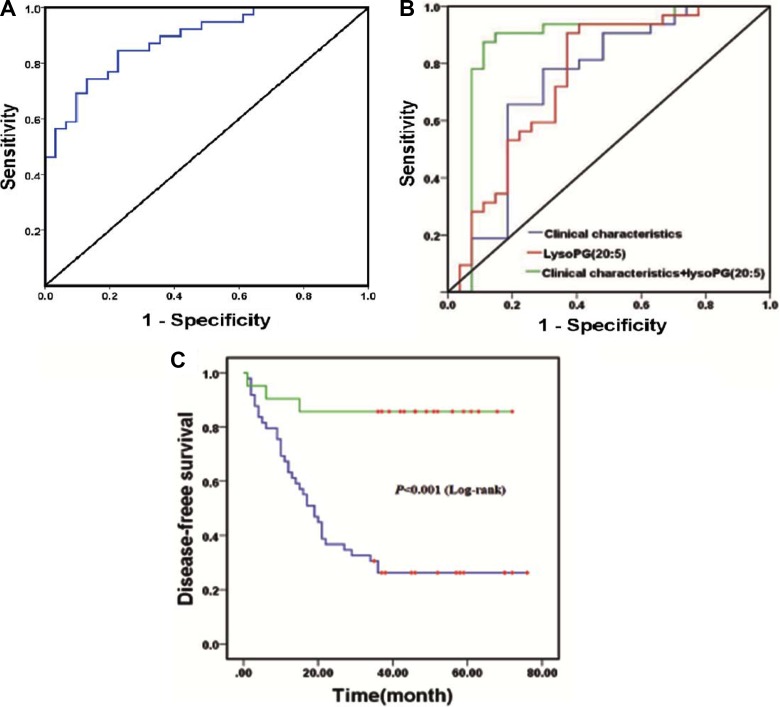
Figure 2.
(A) ROC curves based on the random forest model with leave-one-out cross-validation for prediction with 31 candidate lipid biomarkers; (B) The inclusion of LysoPG(20:5) level to related prognostic clinical characteristics including serum CA-125 level, omentum metastasis, FIGO stage, histology differentiation grade and lymph node metastasis to receiver operating characteristic curve increase the predictive power of EOC recurrence (area: clinical characteristics: 0.739, P < 0.01(blue line); LysoPG(20:5): 0.736, P < 0.001 (red line); clinical characteristics + LysoPG(20:5): 0.875, P < 0.001(green line)); (C) Kaplan–Meier curve comparing EOC recurrence with lower LysoPG(20:5) values (blue line) and higher LysoPG(20:5) values (green line).

