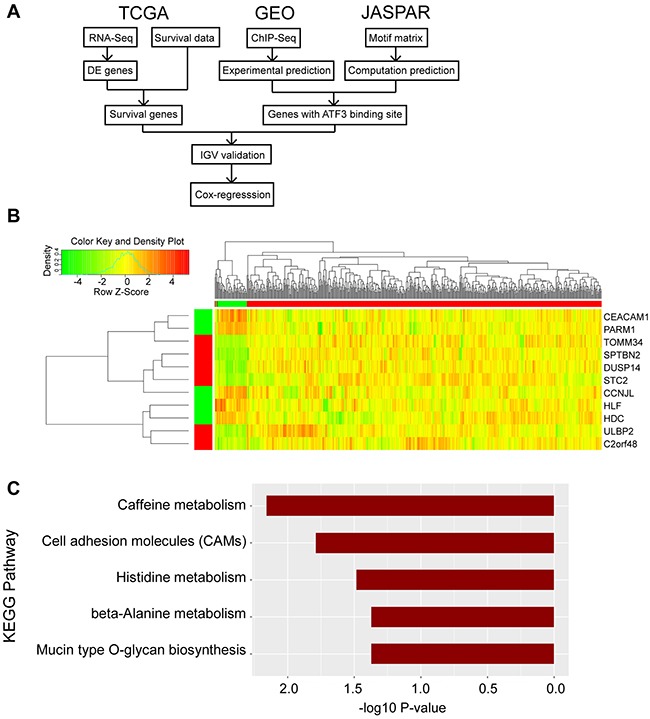
Figure 1. Identified the candidate genes for outcome of CRC.

(A) Flow-chart of the bioinformatic analysis in this research was shown. Data were collected from TCGA, GEO and JASPAR database. (B) Heatmap was generated in RStudio. The top right region represents the hierarchical clustering results, with red and green bars indicating tumor and adjacent normal samples, respectively. The left bottom region represents the 11 DEGs, with red and green bars indicating high and low expression in tumor samples compared to adjacent normal samples. (C) KEGG pathway analysis was conducted in RStudio and p value was shown.
