
Figure 6. molecular signature associates genes with their survival analysis.
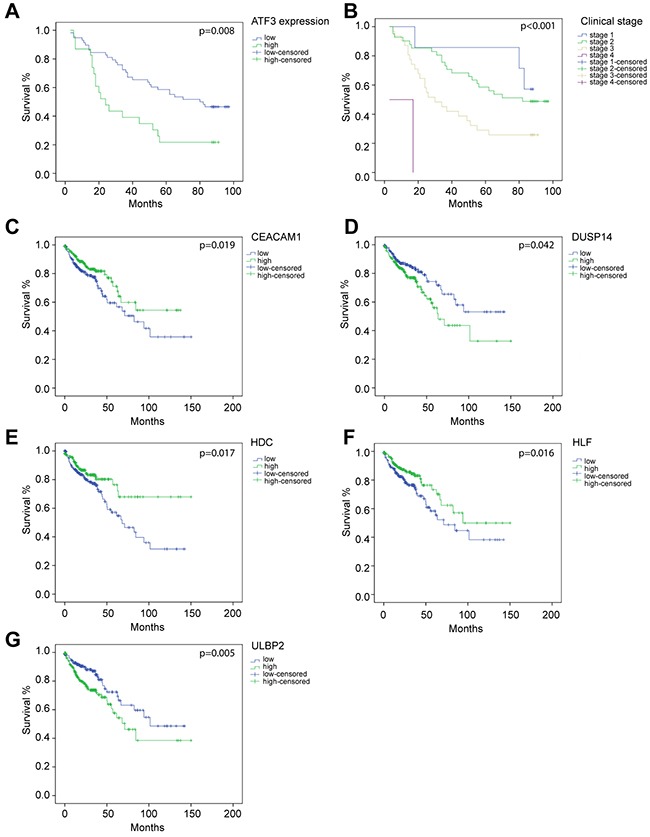
Overall survival curves by Kaplan–Meier method assessed for (A) ATF3 expression based on immunohistochemistry staining (p=0.007), (B) different clinical stages (p<0.001), (C) CEACAM1 mRNA expression (p=0.037), (D) DUSP14 mRNA expression (p=0.022), (E) HDC mRNA expression (p=0.015), (F) HLF mRNA expression (p=0.026), (G) ULBP2 mRNA expression (p=0.004). (A-B) were based on the results of immunohistochemistry. (C-G) were based on data from TCGA database.