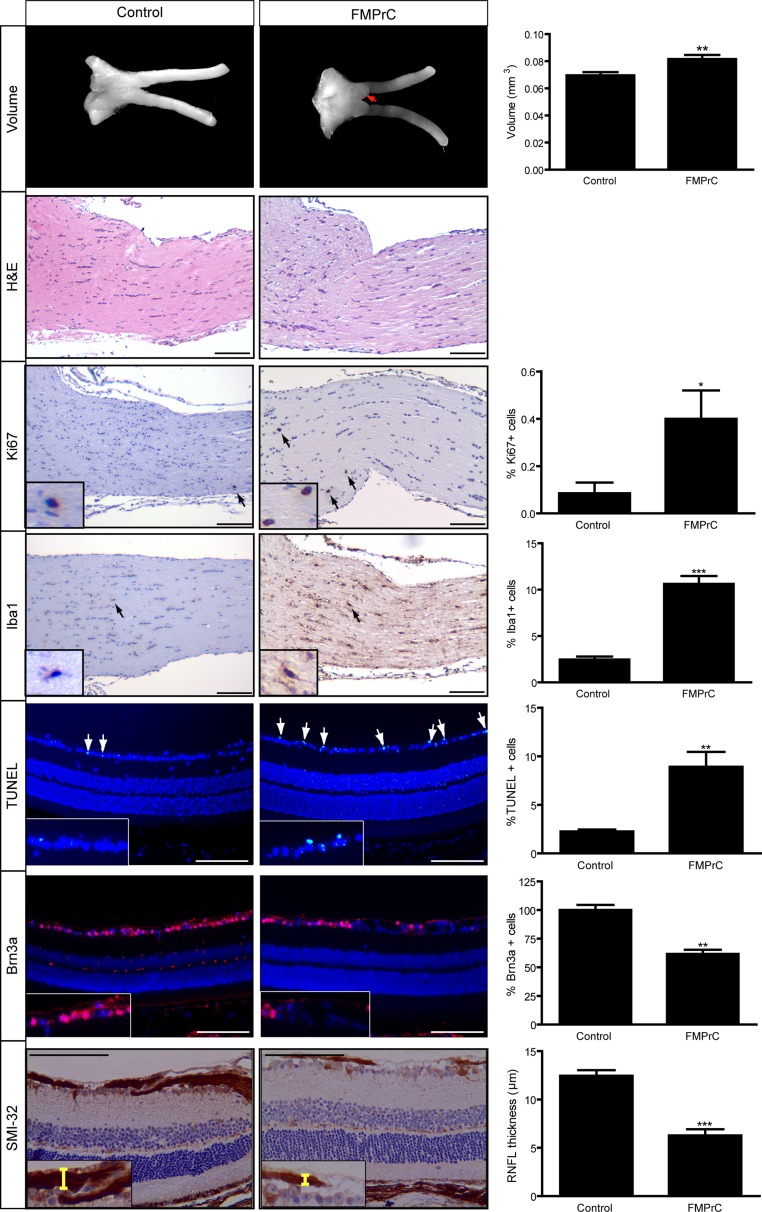
Figure 5. Somatic Nf1 loss in neural stem cells recapitulates the temporal course of optic gliomagenesis observed in FMC mice.
FMPrC mice have larger optic nerve volumes relative to controls, as well as increased cellularity (hematoxylin/eosin) (n = 5 mice/group). 3-month-old FMPrC mice show increased percentages of Ki67+ and Iba1+ cells. There was also increased retinal cell apoptosis (%TUNEL+ cells), fewer Brn3a+ cells, and reduced RNFL thickness in FMPrC mice. Nuclei were counterstained with DAPI (blue). Representative images include insets of immunopositive cells (arrows). Scale bar, 100 μm. Error bars, mean ± SEM. ***p < 0.0003; **p = 0.0079; *p = 0.0429.

