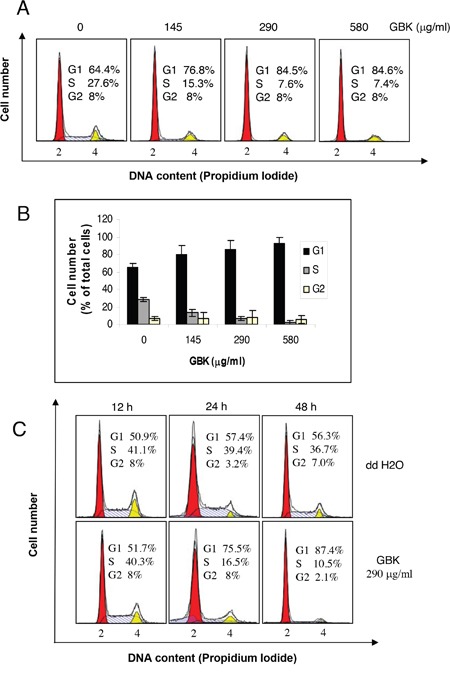
Figure 2. Induction of G1 arrest in GBK-treated MCF-7 breast cancer cells.

(A, B) Proliferating MCF-7 cells were treated with different concentrations of GBK (0–580 μg/ml) for 48 h and cell cycle distributions were analyzed by flow cytometry. Representative flow cytometry data is shown in (A), and columns in (B) show the data expressed as means ± SD of three independent experiments. (C) Proliferating MCF-7 cells were treated with 290 μg/ml GBK for the indicated time and cell cycle distributions were analyzed by flow cytometry. ddH2O was used as control.
