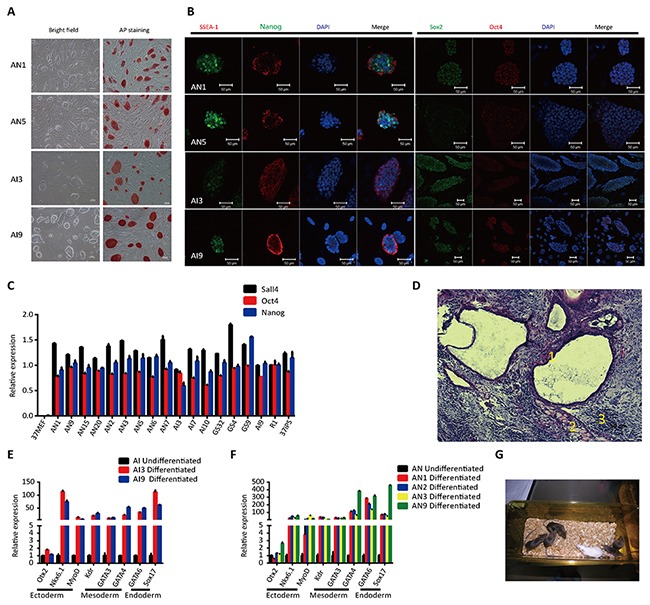
Figure 1. Characteristics of ntESCs and iPSCs from APCs.

(A) Morphology and alkaline phosphatase expression of ntESCs and iPSCs. Scale bars, 100 μm. (B) Immunofluorescence staining of pluripotent markers SSEA-1 (red), Nanog (green), Sox2 (green), and Oct4 (red) in AN and AI lines. Nuclei were stained with DAPI. Scale bars, 50μm. (C) Quantitative PCR analysis of the pluripotent markers Sall4, Oct4 and Nanog in AN and AI lines. Relative mRNA expression is normalized to GAPDH and is represented relative to expression in fibroblasts (37MEF). The experiments were performed in triplicate (means±SD; n=3). The primers used are listed in Supplementary Table 2. (D) H&E staining of teratomas generated from AN1 that formed tissues from all three germ layers. 1: Ectoderm; 2: Mesoderm; 3: Endoderm. Scale bars, 100 μm. A detailed description of all of the cell lines is given in Supplementary Table 1. (E and F) Quantitative PCR analysis showing the upregulation of markers for all three germ layers during the in vitro differentiation of AN and AI lines. Relative mRNA expression is normalized to GAPDH and represented relative to expression in undifferentiated AN and AI lines. The experiments were performed in triplicate (mean±SD; n=3). The primers used are listed in Supplementary Table 2. (G) Germline transmission of an AN1 tetraploid mouse. Details on all of the cell lines are in Supplementary Table 1.
