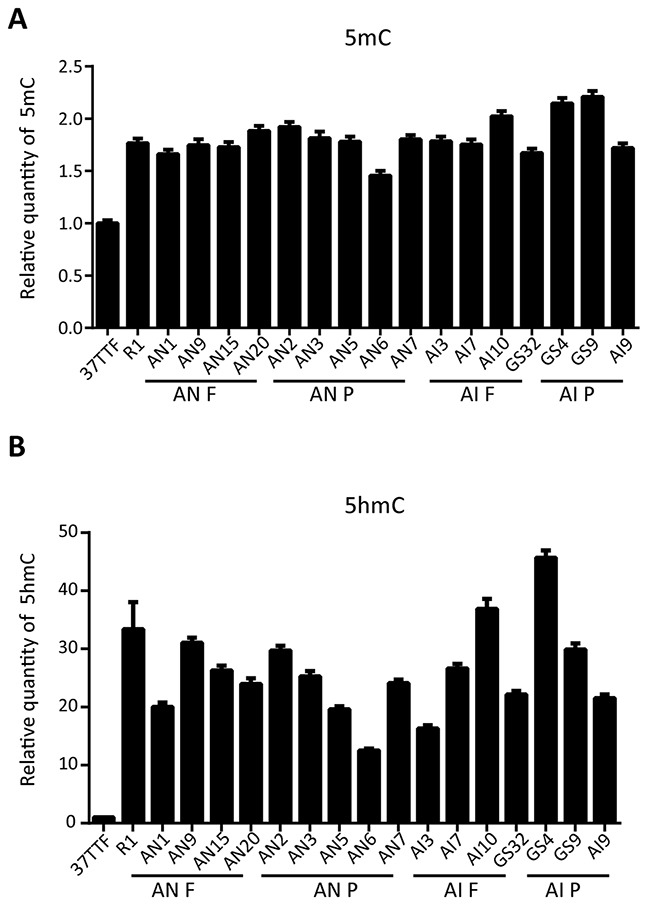
Figure 3. Quantification of 5mC and 5hmC in AN and AI lines.

(A) Quantification of genomic 5mC in AN F, AN P, AI F and AI P cell lines showing values that were normalized and compared to fibroblasts (37 TTF). Experiments were performed in triplicate (mean±SD; n=3). (B) Quantification of genomic 5hmC in AN F, AN P, AI F and AI P cell lines showing values that were normalized and compared to fibroblasts (37TTF). Experiments were performed in triplicate (mean±SD; n=3).
