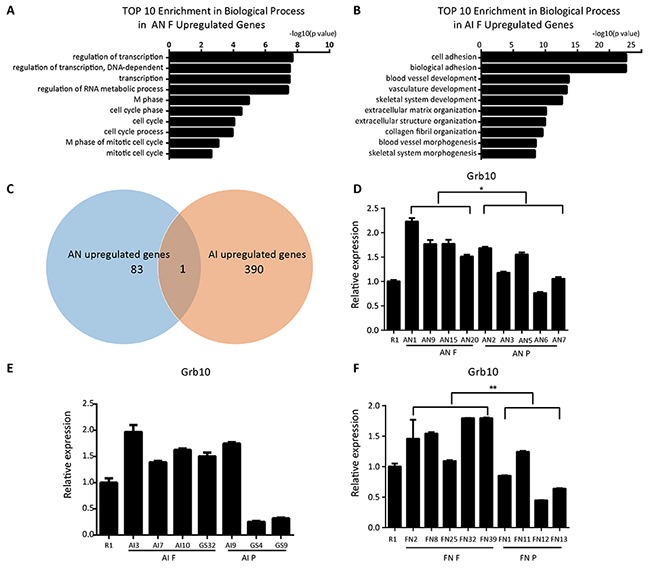
Figure 4. Grb10 is associated with the pluripotency state in ntESCs.

(A) GO analysis based on the upregulated genes from the comparison of fully and partially reprogrammed AN cells performed by David Bioinformatics Resources. (B) GO analysis based on the upregulated genes from the comparison of fully and partially reprogrammed AI cells performed by David Bioinformatics Resources. (C) Venn diagram representing the overlap between AI upregulated genes and AN upregulated genes. The sizes of the overlapping areas are not proportional to the actual number of genes. (D, E and F) Quantitative PCR analysis of Grb10 in AN, AI and FN cell lines. AN F: fully reprogrammed cells by tetraploid complementation assay in AN cell lines; AN P: partially reprogrammed cells by tetraploid complementation assay in AN cell lines; AI F: fully reprogrammed cells by tetraploid complementation assay in AI cell lines; AI P: partially reprogrammed cells by tetraploid complementation assay in AI cell lines; FN F: fully reprogrammed cells by tetraploid complementation assay in FN cell lines; FN P: partially reprogrammed cells by tetraploid complementation assay in FN cell lines. Relative mRNA expression is normalized to GAPDH and is represented relative to expression in R1 ESCs. The experiments were performed in triplicate (means±SD; n=3; Student's t test; *p<0.05; **p<0.01, and ***p<0.001). And there is no significant difference in the inside of the AIF, AIP, ANF and ANP groups (n=3, F>0.05, one-way ANOVA). The primers used are listed in Supplementary Table 2.
