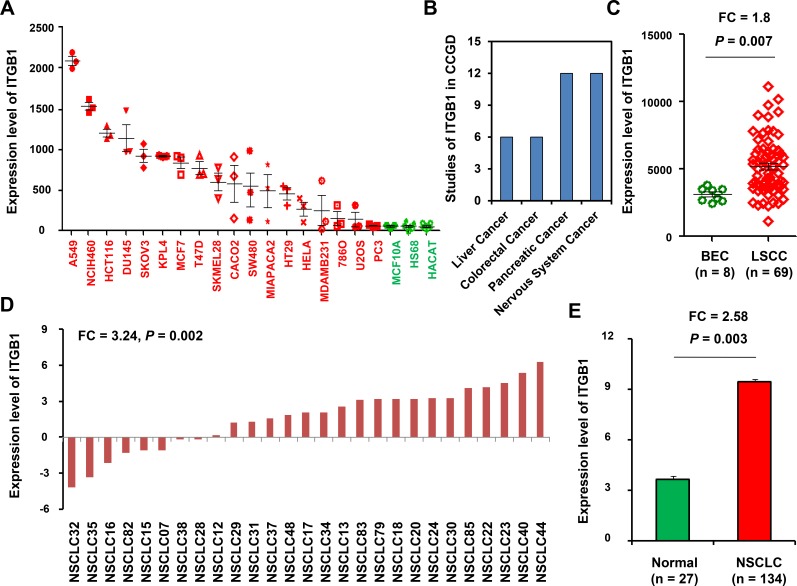
Figure 2. Analysis of ITGB1 expression in NSCLC.
(A) Relative expression levels of ITGB1 in different cancer cell lines vs. normal controls from the GEO dataset (GSE41445). (B) ITGB1 was indicated as a potential cancer driver in the Candidate Cancer Gene Database (CCGD), involved in liver, colorectal, pancreatic and nervous system cancer. (C) Relative expression levels of ITGB1 in a microarray profiles data (GSE67061-GPL6480) from GEO database, which including 8 cases of immortalized human bronchial epithelial cell lines (BEC) and 69 cases of lung squamous cell carcinoma tissues (LSCC). (D) ITGB1 expression levels in cancer vs. paired adjacent non-tumor tissue (n = 27). (E) ITGB1 expression in tumor samples (n = 134) and adjacent non-tumor lung tissue (n = 27) were analyzed using qRT-PCR assay.

