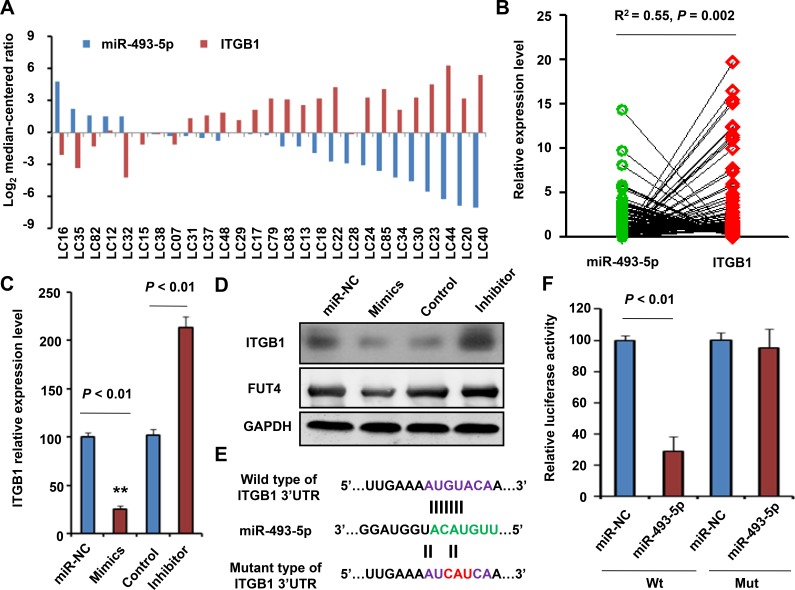
Figure 4. Validation of ITGB1 as a direct target of miR-455-3p.
(A) The relationship of ITGB1 levels with the expression of miR-493-5p in cancer vs. paired adjacent non-tumor tissue (n = 27). (B) The relationship of ITGB1 levels with the expression of miR-493-5p in 134 NSCLC samples. qRT-PCR (C) and Western blotting (D) were used to measure the mRNA and protein level of ITGB1 after treatment of miR-493-5p mimics (overexpression) or inhibitor (knockdown) in HeLa cells. (E) A schematic diagram of the miR-493-5p of 3′UTR in ITGB1 binding site and mutation site. (F) Luciferase activity assay of pGL3-ITGB1-3′UTR reporter co-transfected with miR-493-5p mimic or miR-493-5p -mut oligonucleotides in HeLa cells. Data shown are the means ± SD of three independent experiments.

