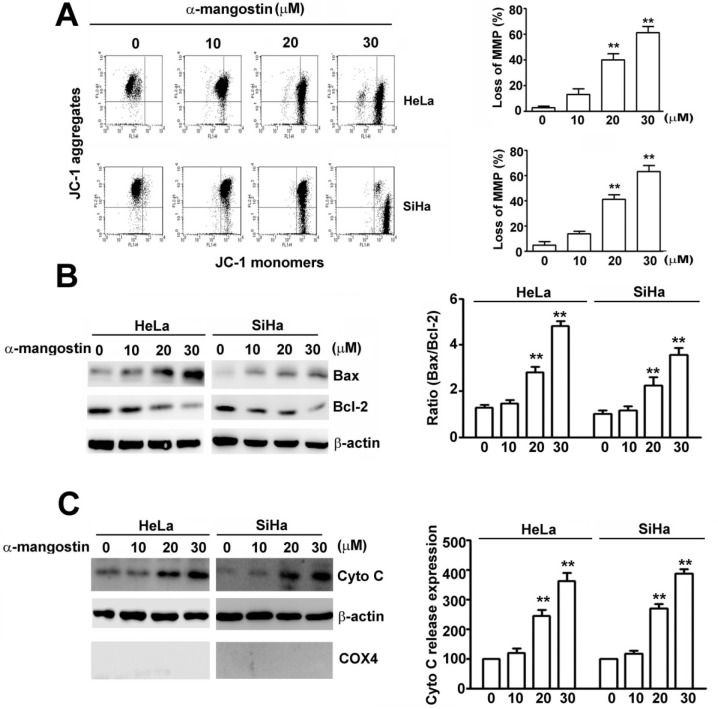
Figure 2. Effects of α-mangostin on apoptotic responses in cervical cancer cells.
Cells were treated with increased concentrations of α-mangostin (0, 10, 20 and 30 μM) for 24 h. (A) The mitochondrial membrane potential (MMP) was determined by JC-1 staining. Damage of mitochondria was evaluated by loss of MMP (a decrease of JC-1 aggregates) as shown in the right plot. (B) Cell lysate was collected and expressions of Bax, Bcl-2, and β-actin were examined by immunoblotting. β-actin is shown as an internal control. The ratio of Bax/Bcl-2 in each treatment is shown in the right plot. (C) Cytosol and mitochondrial fractions were isolated. Expressions of indicated proteins were determined by immunoblotting. β-actin is shown as an internal control and cytosolic marker. COX4 was used as a mitochondrial marker. Quantitative results of cytochrome C release into cytosol are shown in the right plot. **P < 0.01.

