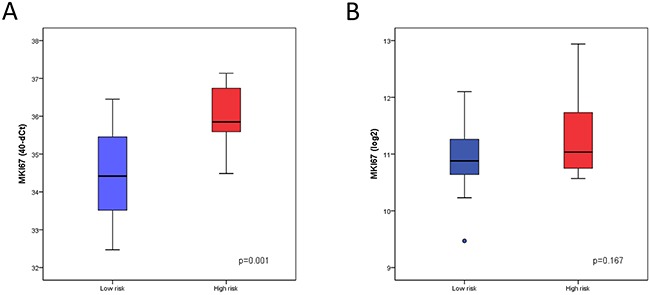
Figure 5. Differential expression of MKI67 between risk groups.

(A) Expression analysis of MKI67 determined by qRT-PCR in the low risk group (n=30) and high risk group (n=54) of the Mannheim cohort. (B) Expression analysis of MKI67 determined by Illumina microarray analysis in the low risk group (n=10) and high risk group (n=51) of the Chungbuk cohort.
