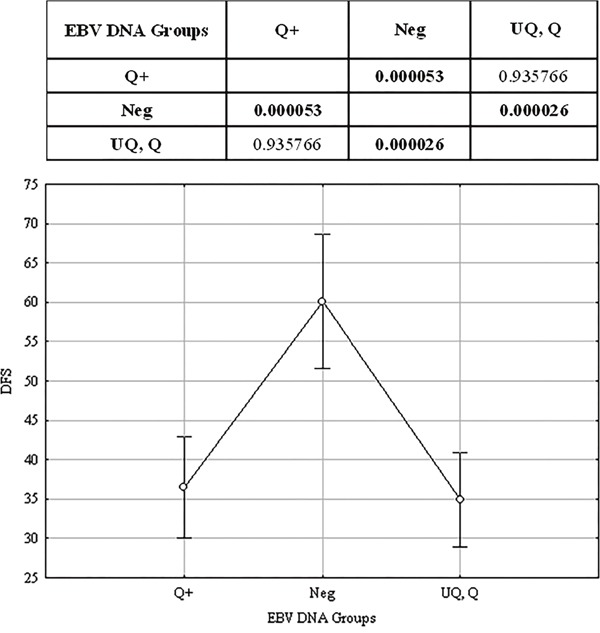
Figure 3. Results of Tukey HSD test.

EBV DNA was stratified into 4 groups: Neg, Negative (EBV DNA = 0); UQ, Positive but UnQuantifiable (0 < EBV DNA < 102 copies/mL); Q, Positive and quantifiable (102 ≤ EBV DNA ≤ 15 × 102 copies/mL); Q+, Strongly positive and quantifiable (EBV DNA > 15 × 102 copies/mL). The upper panel shows the results of the Tukey's HSD test: P values corresponding to the difference between group pairs are displayed. Highlighted values are statistically significant (P<0.05). The lower panel shows the median values of the three groups and their confidence intervals.
