
Figure 5. The flowchart of the current study.
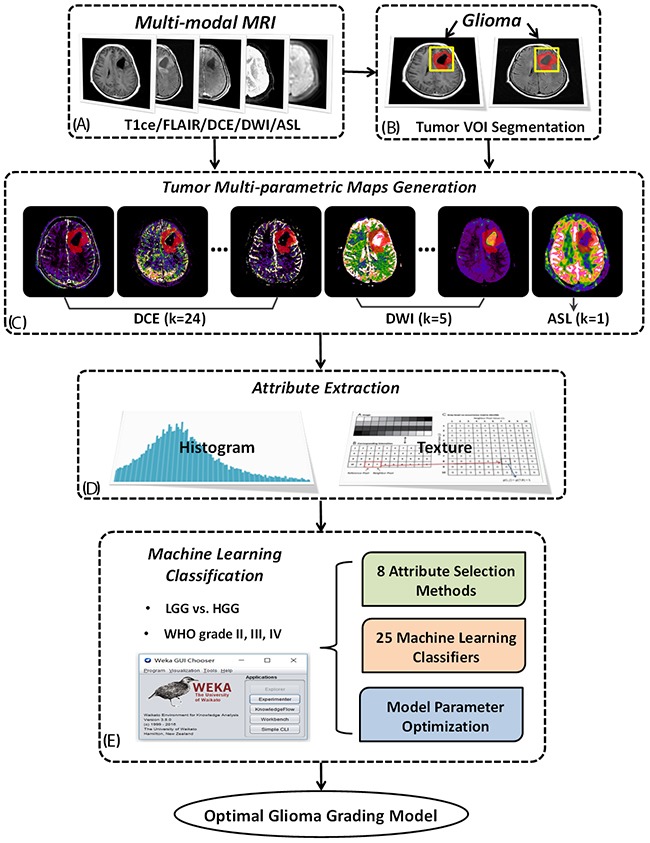
Based on multi-modal MRI data including DCE-MRI, multi-b DWI and 3D-ASL (A) and tumor volume of interest (VOI) manually drawn on resampled T1ce or FLAIR image (B), a group of permeability, diffusion and perfusion parametric images were derived and the corresponding parametric maps of the whole tumor region were extracted (C). Utilizing histogram analysis and texture analysis, a big collection of tumor parameter attributes was acquired for the following machine learning process (D). 25 commonly used classifiers and 8 attribute selection methods were implemented and compared using WEKA software with additional discussion on model parameters to construct the optimal glioma grading model (E).