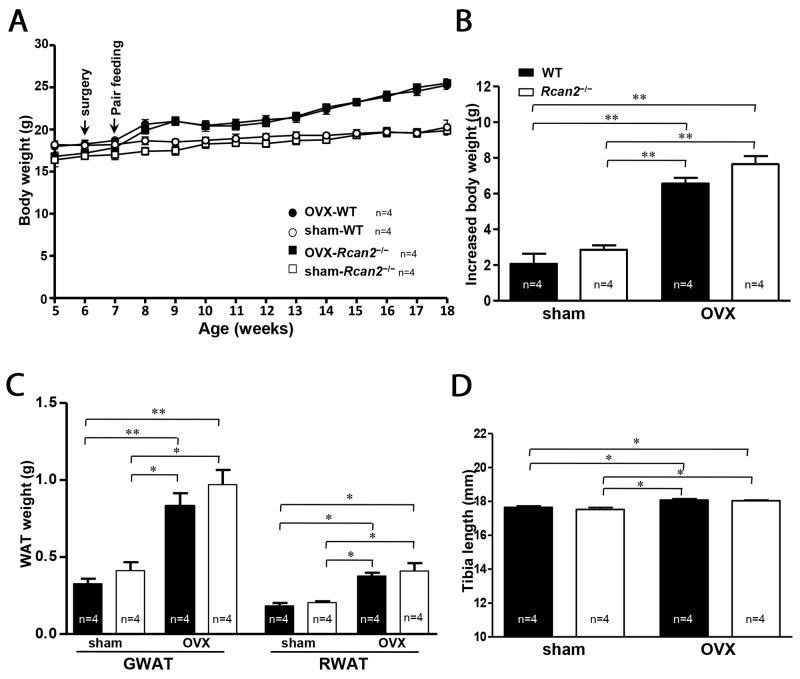
Figure 4. A pair-feeding study between sham-operated and ovariectomized mice on a NCD.
(A) Growth curves, (B) increased body weight, (C) mean adipose tissue weight (gonadal and retroperitoneal white adipose tissue respectively), and (D) mean tibia lengths in sham-operated (sham) mice and ovariectomized (OVX) female mice after 11-week pair-feeding study. Arrows show the time of sham (or OVX) operation and the start point of pair feeding. The number of mice (n) used in the experiments was indicated directly in each panel of figures. Statistics were performed using one-way ANOVA, and individual group differences presented here were measured using Bonferroni correction. *: p <0.05, **: p <0.01. All values are given as means ± SEM.

