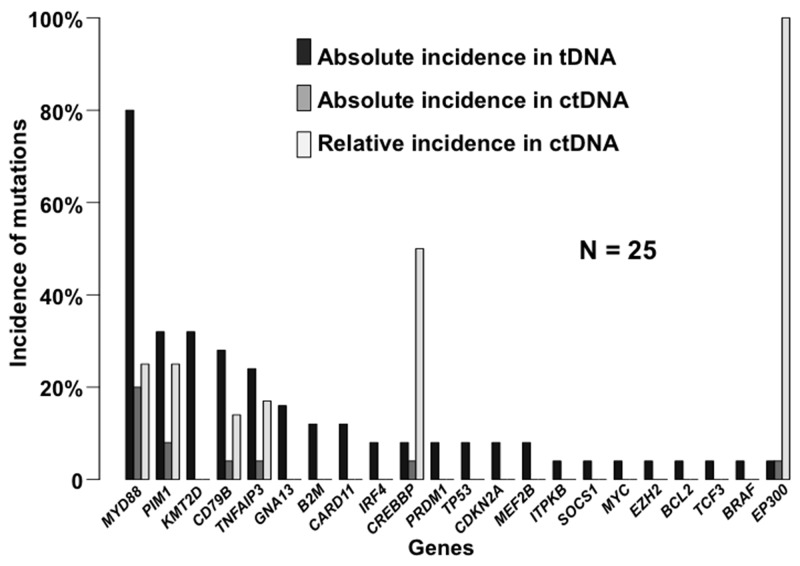
Figure 2. The incidence of somatic mutations in PCNSL identified by Lymphopanel sequencing, and in the matched ctDNA according to the targeted panel sequencing.
Mutation frequencies are expressed per gene in this stacked histogram. Black bars represent altered genes for PCNSL, dark gray bars represent the absolute proportion in the ctDNA, and light gray bars represent the relative proportion in the ctDNA.

