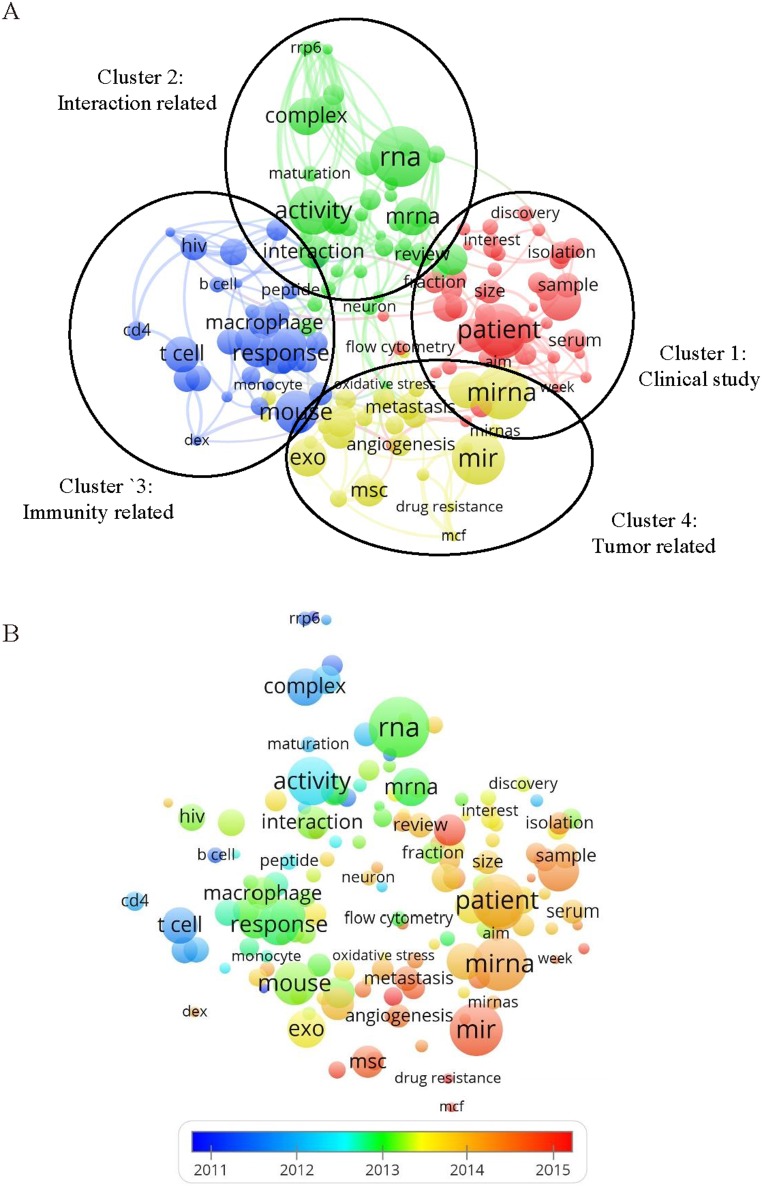
Figure 4. The analysis of key words.
(A) Mapping on key words of exosome, the keywords were divided into four clusters according to different colors generated by default: Clinical Study (right in red), interaction related study (up in green), immunity related study (left in blue) and tumor related study (down in yellow). A large size of a circle represents the keyword appears at a high frequency; (B) Distribution of key words according to when they appeared for the average time, key words in blue presented earlier than those in yellow or red. Two terms are defined to co-occur if they both occur on the same line in the corpus file. In general, the smaller the distance between two terms, the larger the number of co-occurrences of the terms.

