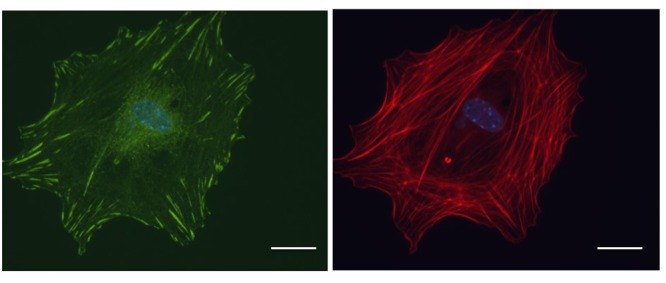
Figure 4. Microscopic visualization of FAs.

Primary tumor cells isolated from MMTV-PyMT tumors were plated on a Fibronectin-coated cover slip and labeled with Vinculin (green) to visualize FAs and DAPI (blue) to visualize the nucleus. Phalloidin (red) staining is shown in the right panel. Scale bar: 10μm.
