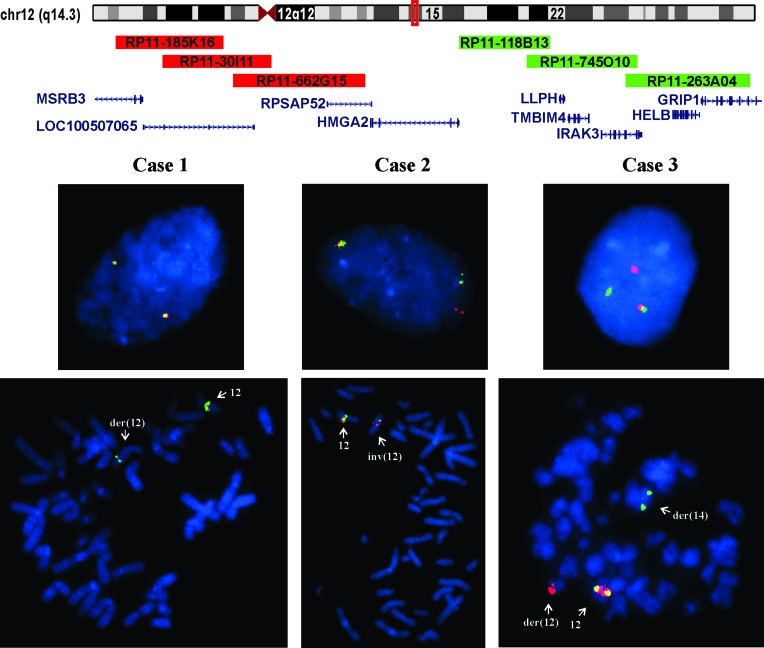
Figure 3. Interphase and metaphase FISH analyses of leiomyomas of deep soft tissue from group 1 with 12q anomalies.
Ideogram of chromosome 12 with the location of HMGA2 (red box) and the BACs used for FISH experiments are shown. The 5´-end of the probe (red signal) was constructed from a pool of the clones RP11-185K16, RP11-30I11, and RP11-662G15. The 3´-end of the probe (green signal) was constructed from a pool of the clones RP118B13, RP11-745O10, and RP11-263A04. In case 1, the analysis showed absence of the red signal (deletion of the 5´-end of the probe) in both metaphase spreads and interphase nuclei. In case 2, interphase FISH showed split between red and green signals (5´-end and 3´-end probes). The FISH on metaphase spreads showed that the green signal (3´-end of the probe) was moved to 12p. In case 3, interphase FISH showed split between red and green signals (5´-end and 3´-end probes). The FISH on metaphase spreads showed that the green signal (3´-end of the probe) had moved to 14q.

