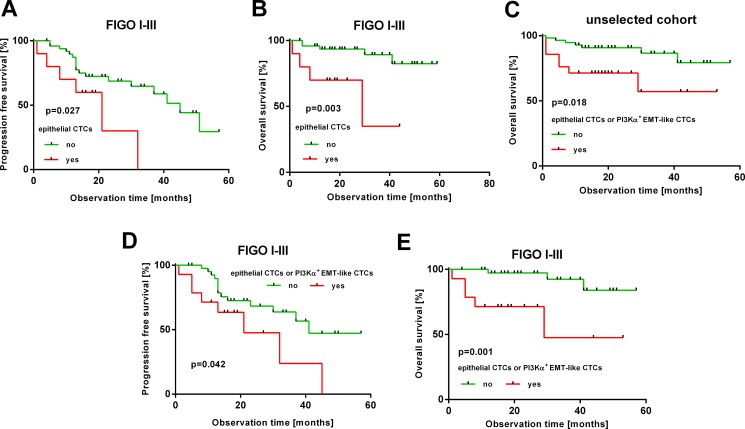
Figure 4. Prognostic relevance of epithelial and EMT-like CTCs.
The Kaplan-Meier plots show prognostic relevance of different CTC-subtypes at primary diagnosis. (A, B): epithelial CTCs in FIGO I-III patients (thus without distant metastasis) (C): epithelial or PI3Kα-positive CTCs in the unselected patient cohort (D, E): epithelial or PI3Kα-positive EMT-like CTCs in FIGO I-III patients. Red curves represent patients, positive for the respective CTC-subtype(s); green curves represent patients, negative for the indicated CTC-subtype(s).

