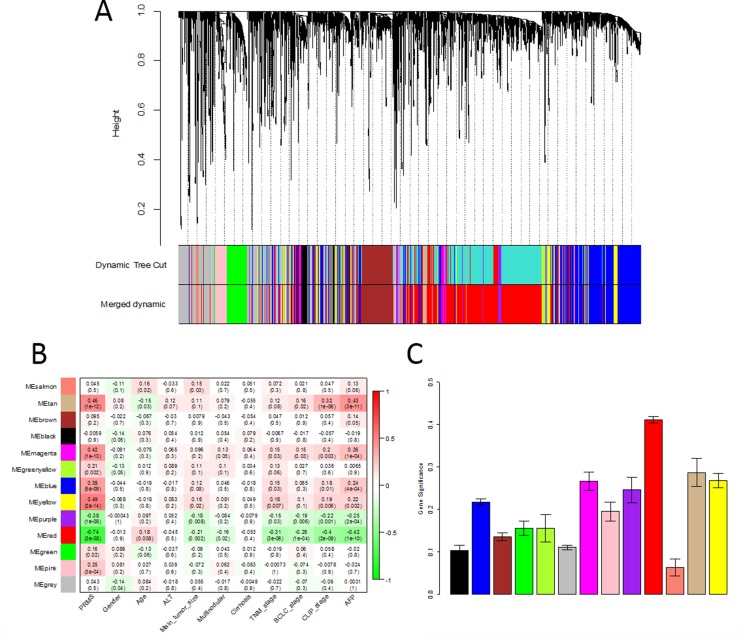
Figure 3. Identification of modules associated with clinical traits.
(A) Clustering dendrogram of all differentially expressed genes in 214 samples of hepatocellular carcinoma. (B) Heatmap between the correlation between module eigengenes and clinical traits. Each cell contained the corresponding correlation and P value (C) Distribution of average gene significance and errors in the modules associated with the metastasis risk in hepatocellular carcinoma.

