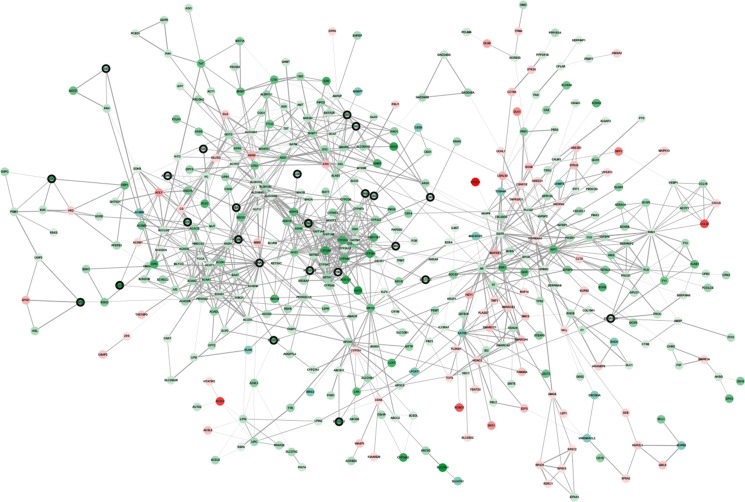
Figure 4. Protein–protein interaction network of genes in the red module.
The color intensity in each node was proportional to change fold of expression in comparison to non-tumor samples (up-regulation in red and down-regulation in green). The nodes with bold circle represented the hub genes identified by co-expression network analysis. The edge width was proportional to the score of protein-protein interaction based on the STRING database.

