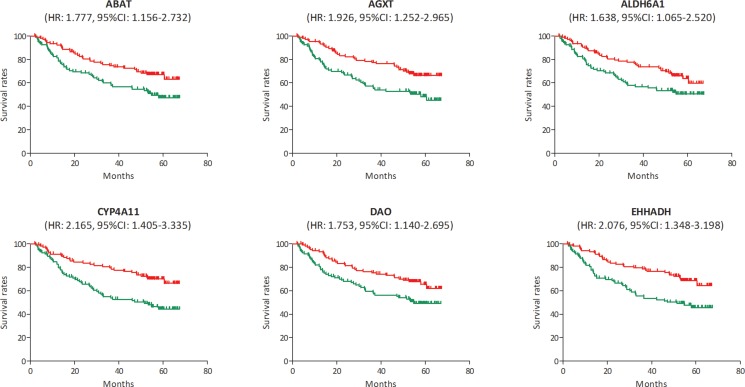
Figure 7. Survival analysis of the association between the expression levels of ABAT, AGXT, ALDH6A1, CYP4A11, DAO and EHHADH and survival rates in hepatocellular carcinoma (HCC) (based on microarray data of GSE14520).
Red line represented the samples with gene highly expressed, and green line was for the samples with gene lowly expressed. HR: hazard ratio, CI: confidence interval.

