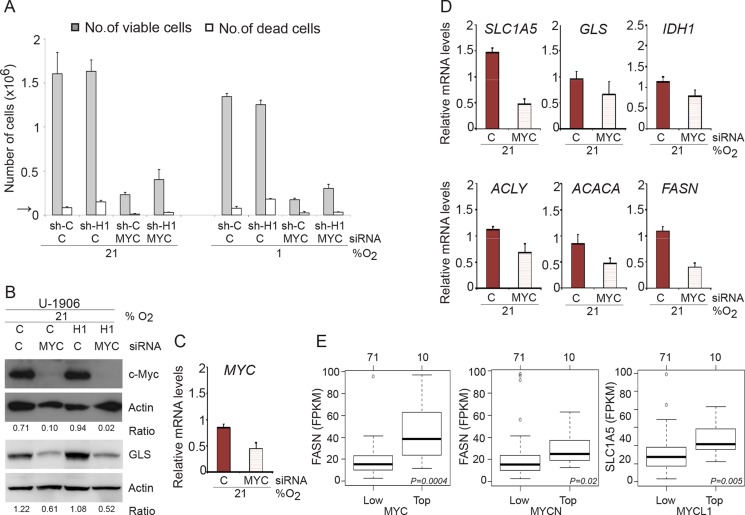
Figure 7. MYC knockdown affect proliferation in SCLC cells.
(A) U-1906 cells transduced with shHIF-1α (sh-H1) or a non-targeting control (sh-C) were transfected with siRNA against MYC and cultured for 72 hours at 21% or 1% oxygen. A non-targeting siRNA was used as control. The numbers of viable and dead cells were counted. The arrow indicates the number of cells seeded at day 0. (B) c-Myc and GLS western blot analyses of whole cell lysates from shHIF1A (H1) and non-targeting shRNA (C) transduced U-1906 cells. Actin was used as a loading control. The ratio c-MYC/Actin and GLS/Actin was calculated. (C, D) U-1906 cells were transfected for 24 hours at 21% oxygen. The relative mRNA expression levels of MYC, SLC1A5, GLS, IDH1, ACLY, ACACA and FASN were analyzed by qPCR and the expression data were normalized to three reference genes (HPRT1, UBC, TBP). One representative experiment is shown; error bars show the standard deviation within triplicates. (E) Expression of FASN for the 10 SCLC tumors with highest expression of MYC (left panel) or MYCN (centerpanel) versus 71 remaining SCLC tumors from George et al. (PMID:26168399). Right panel shows corresponding expression of SLC1A5 for the 10 highest expressing MYCL1 SCLC tumors versus remaining 71 tumors. P-values are calculated using Wilcoxon's test.

