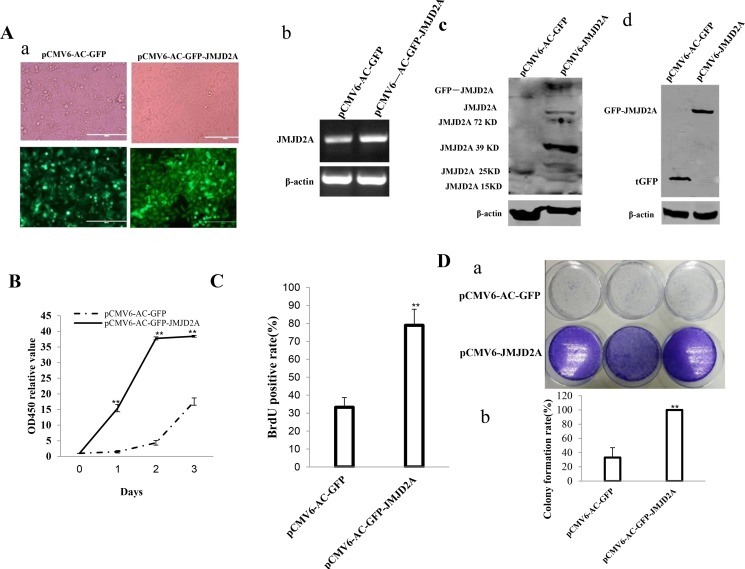
Figure 1. JMJD2A accelerates liver cancer cell growth in vitro.
(Aa) The photography of the Hep3B cell lines transfected with pCMV6-AC-GFP or pCMV6-AC-GFP-JMJD2A. (Ab) RT-PCR for JMJD2A cDNA in JMJD2A overexpressed control Hep3B stable cell lines;β-actin as internal control. (Ac) Western blotting with anti- JMJD2A in JMJD2A overexpressed control Hep3B stable cell lines; β-actin as internal control. (Ad) Western blotting with anti-tGFP in JMJD2A overexpressed control Hep3B stable cell lines; β-actin as internal control. (B) Cell proliferation assay was performed in 96-well format using the CCK8 cells proliferation kit to determine the cell viability as described by the manufacturer. Each sample was assayed in triplicates for 3 days consecutively. Cell growth curve was based on the corresponding the relative values of OD450 and each point represents the mean of three independent samples. Data are means of value from three independent experiments, bar ± SEM. **P < 0.01; *P < 0.05. (C) Cell BrdU assay. Data are means of value from three independent experiment, bar ± SEM. **P < 0.01; *P < 0.05. (D) (upper) The photography of colonies from the cell lines indicated in left. (lower) Cell plate colony formation ability assay. Data are means of value from three independent experiment, bar ± SEM. **P < 0.01; *P < 0.05.

