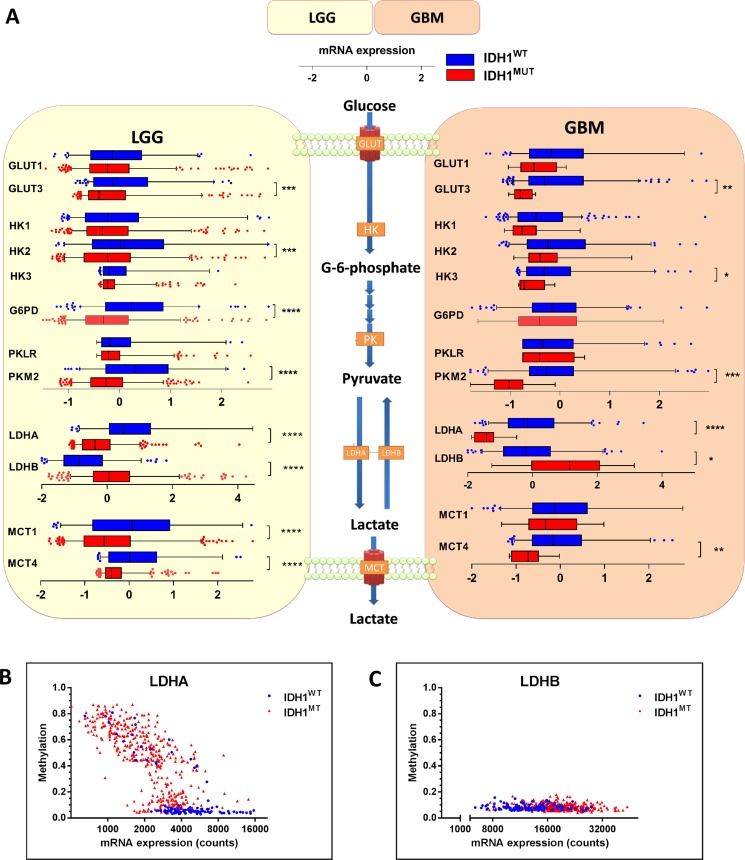
Figure 1. mRNA expression levels of enzymes involved in glucose metabolism in IDH1WT versus IDH1MUT glioma.
IDH1WT glioma show higher expression levels of genes that are typically upregulated in glycolytic cancer cells. (A) Analysis of gene expression levels of metabolic enzymes involved in transport and metabolism of glucose in IDH1WT (n = 399) and IDH1MUT (n = 112) LGG and IDH1WT (n = 157) and IDH1MUT (n = 9) glioblastoma samples obtained from the TCGA database. Relative mRNA expression levels are shown for IDH1WT (blue) and IDH1MUT (red). (B) LDHA and (C) LDHB expression and methylation according to IDH1MUT status (blue: IDH1WT, red: IDH1MUT). Abbreviations: GLUT, glucose transporter; HK, hexokinase; G6PD, glucose-6-phosphate dehydrogenase; PK, pyruvate kinase; LDH, lactate dehydrogenase.

