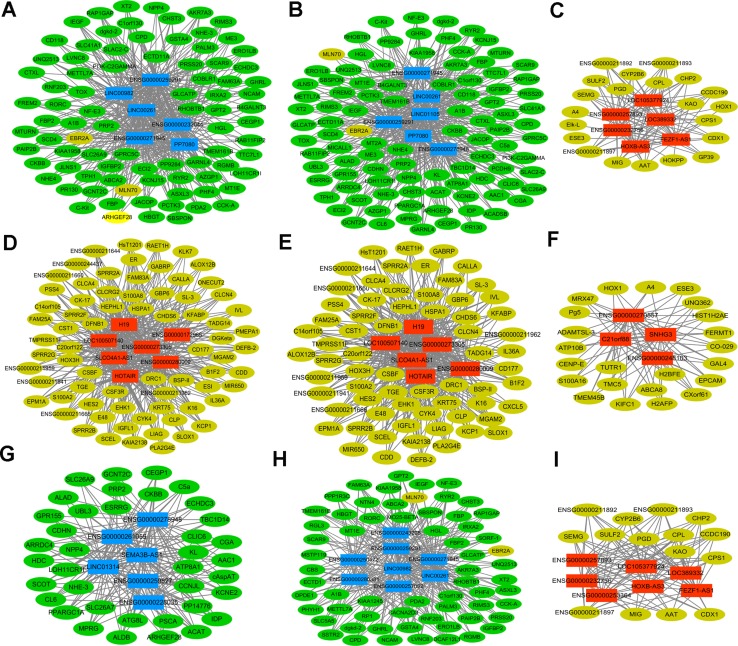
Figure 4. Sub-networks of DElncRNAs/DEmRNAs co-expression.
(A) the sub-network of LINC00261; (B) the sub-network of LINC01105; (C) the sub-network of FEZF1-AS1; (D) the sub-network of H19; (E) the sub-network of HOTAIR; (F) the sub-network of SNHG3; (G) the sub-network of SEMA3B-AS1; (H) the sub-network of LINC00982; (I) the sub-network of LINC105377924. Circular node represented DEmRNA and rectangle node represented DElncRNA. Yellow was up-regulated DEmRNA and green was down-regulated DEmRNAs; Red indicated up-regulated DElncRNA and blue indicated down-regulated DElncRNA.

